Predictive segments
Ce contenu n'est pas encore disponible dans votre langue.
Predictions rank the users of your app every day by how likely they are to stop opening the app (churn) or to do a specific event, such as a purchase. Each prediction writes the score and category to two user tags, so you can build segments and journeys for the users most at risk or most likely to convert.
Prediction types
Anchor link toWhen you create a prediction, choose what it predicts:
| Type | Who gets a high score |
|---|---|
| Churn | Users who will stop opening the app within the prediction window |
| Event likelihood | Users who will do the selected event within the prediction window |
The prediction window is the period the prediction looks ahead. For churn, choose 7, 14, 21, or 28 days, or Auto: Pushwoosh picks a window of 7 to 42 days, in whole weeks, from how long your users usually take to come back to the app. For an event, choose 7, 14, or 30 days.
Prediction tags
Anchor link toEach prediction writes two tags to every scored user:
| Tag | Type | Values |
|---|---|---|
PW Predict · <prediction name> Score | Integer | 0 to 100, in steps of 5 |
PW Predict · <prediction name> Category | String | low, medium, high, very_high |
The score is the user’s rank among all scored users of the app, as a percentile. A score of 90 means the user is more likely to churn (or to do the event) than about 90% of the scored users. The score isn’t the probability that the user churns. A user with a score of 90 can still be unlikely to churn if few users of your app churn at all. To see how many users in a score range actually churned or did the event, check the prediction details page.
The category groups the same ranks into four bands:
| Category | Score |
|---|---|
low | Below 40 |
medium | 40 to 69 |
high | 70 to 89 |
very_high | 90 and above |
The score is a share of users, so the bands always split the scored users the same way: about 10% of them are very_high, about 20% are high, about 30% are medium, and about 40% are low. A user close to a band boundary keeps the previous score and category until they move clearly past it, so tags don’t change back and forth every day.
Pushwoosh scores only users who opened the app within the period set in Score users active in the last. When a user drops out of that period, Pushwoosh removes both tags from the user.
Create a prediction
Anchor link to- Go to Audience → Predictions.
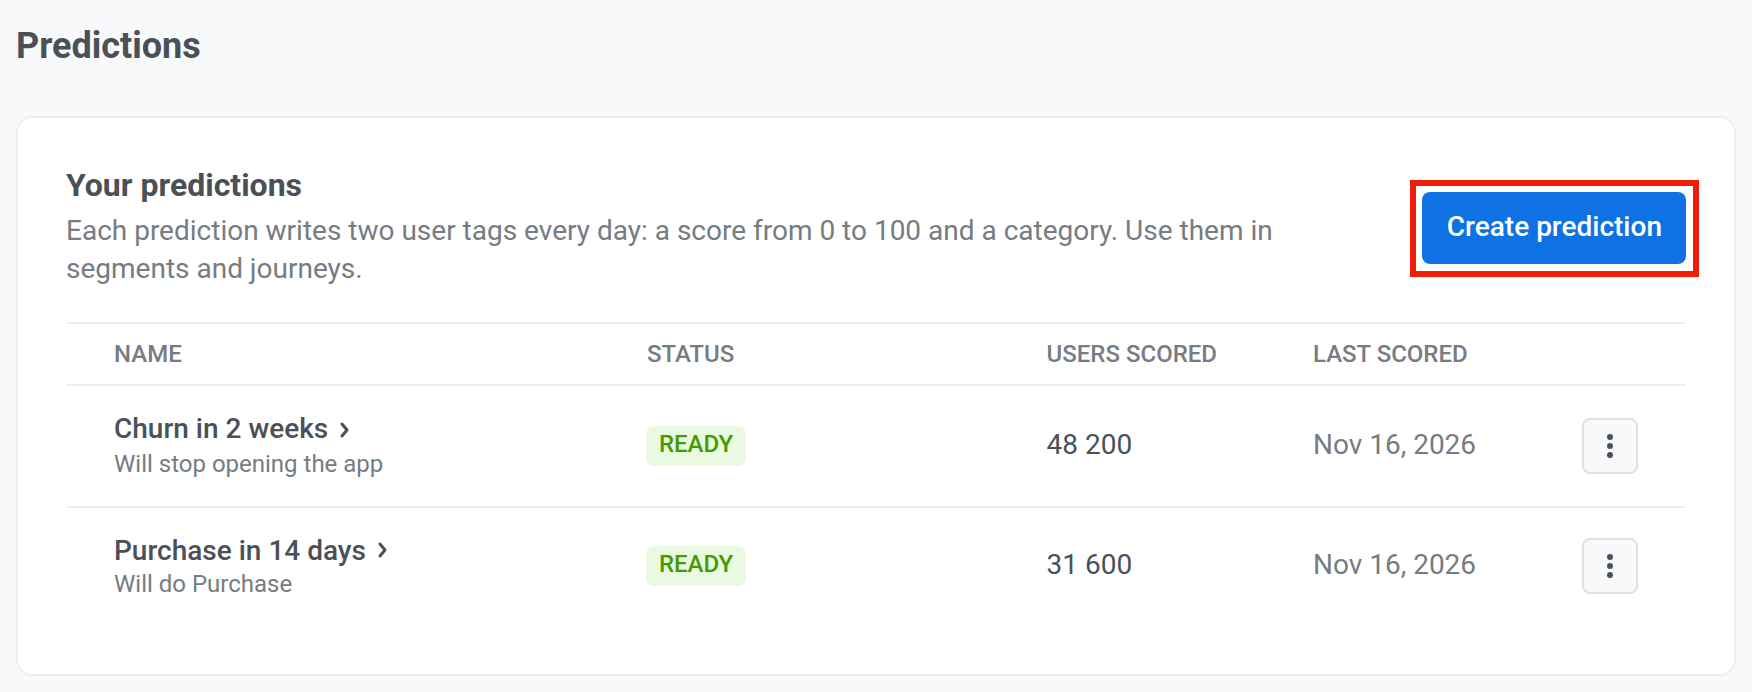
- Click Create prediction.
- Enter a Name. The name becomes part of the tag names, for example
PW Predict · Churn in 2 weeks Score. - In What to predict, choose Churn or Event likelihood.
- For Event likelihood, select the Event to predict.
- Choose the Prediction window.
- In Score users active in the last, choose 30, 60, or 90 days.
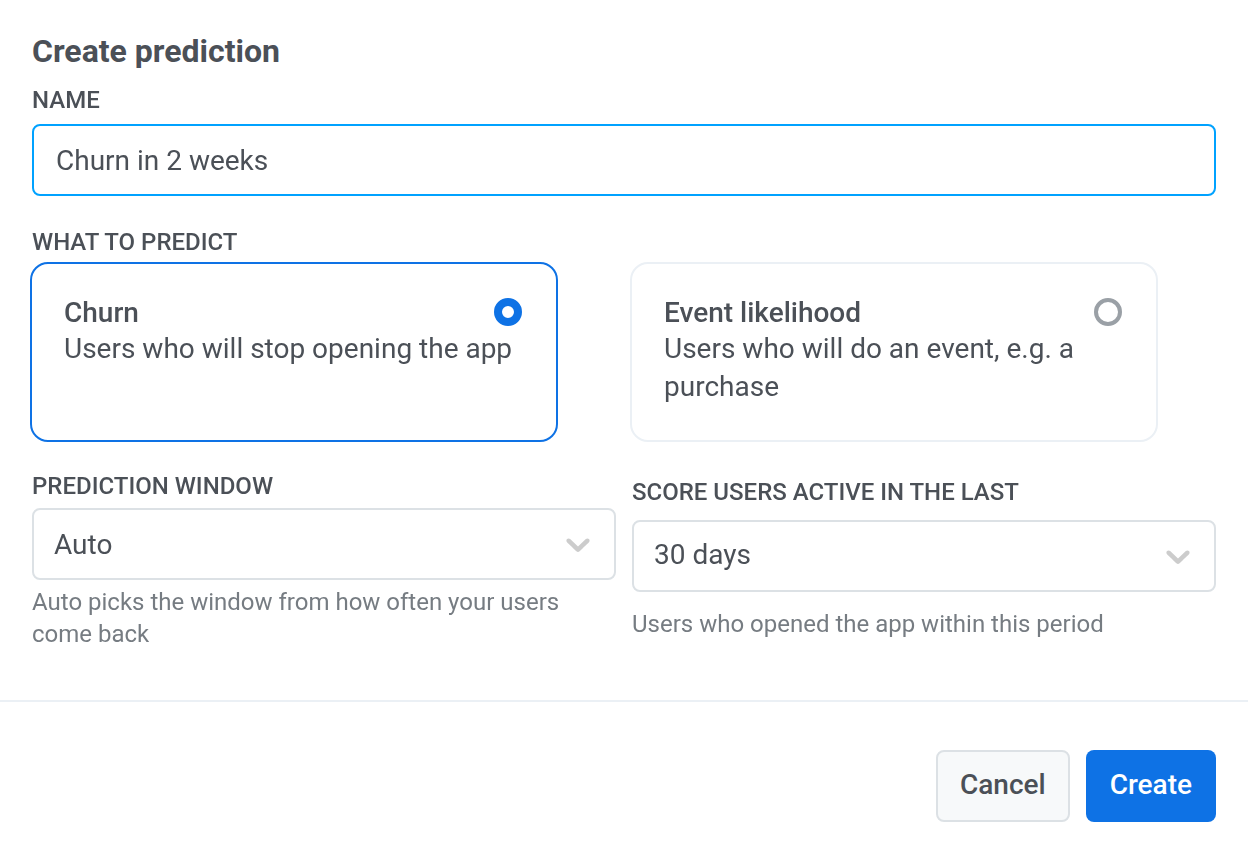
- Click Create.
The prediction runs once a night. The first scores and tags appear after the next nightly run. After that, Pushwoosh updates scores every day and retrains the model every week.
Prediction statuses
Anchor link toThe Status column on the Predictions page shows whether the prediction writes tags:
| Status | What it means |
|---|---|
| Training | The model hasn’t been built yet. It waits for the next nightly run. |
| Waiting for data | The app hasn’t tracked the predicted event long enough. The reason under the status says from which date the history is needed. |
| Not enough signal | The model doesn’t predict noticeably better than a simple rule based on when the user was last active, or too few users churned or did the event. The reason is shown under the status and on the prediction details page. |
| Ready | The model passed the quality check. Pushwoosh writes the score and category tags every day. |
Pushwoosh writes tags only while the prediction is Ready. A Paused badge next to the status means the prediction isn’t scored until you resume it.
Check prediction quality
Anchor link toTo decide how many users to target, click the prediction name on the Predictions page to open the prediction details page. For a Ready prediction, it shows how well the model performed on a past test period:

- Model accuracy (ROC AUC): how well the model separates users who churned (or did the event) from those who didn’t. A value close to 0.5 means the model is no better than a random guess, and 1 means a perfect ranking. The line under the value shows the accuracy of ranking users only by their last activity, so you can compare the two.
- Churn within N days or Do event within N days: the share of all scored users who churned or did the event. This is the result you get if you target users without the prediction.
- Users scored: how many users received the tags.
- Last scored: the date of the latest nightly run.
Create a segment from a prediction
Anchor link toThe Build a segment table on the prediction details page shows what you get if you target the top 5%, 10%, 20%, 30%, or 50% of users by score:
- Score: the threshold. The segment keeps users whose score tag is at or above it.
- Users: about how many users fall into the segment today.
- Precision: the share of users in the segment who churned or did the event in the test period. Compare it with the share of all scored users in the quality cards above.
- Coverage: the share of all users who churned or did the event that the segment includes.
A smaller segment is more precise but includes fewer of the users you want to reach. To create a segment:
- Click Create segment in the row with the threshold you want.
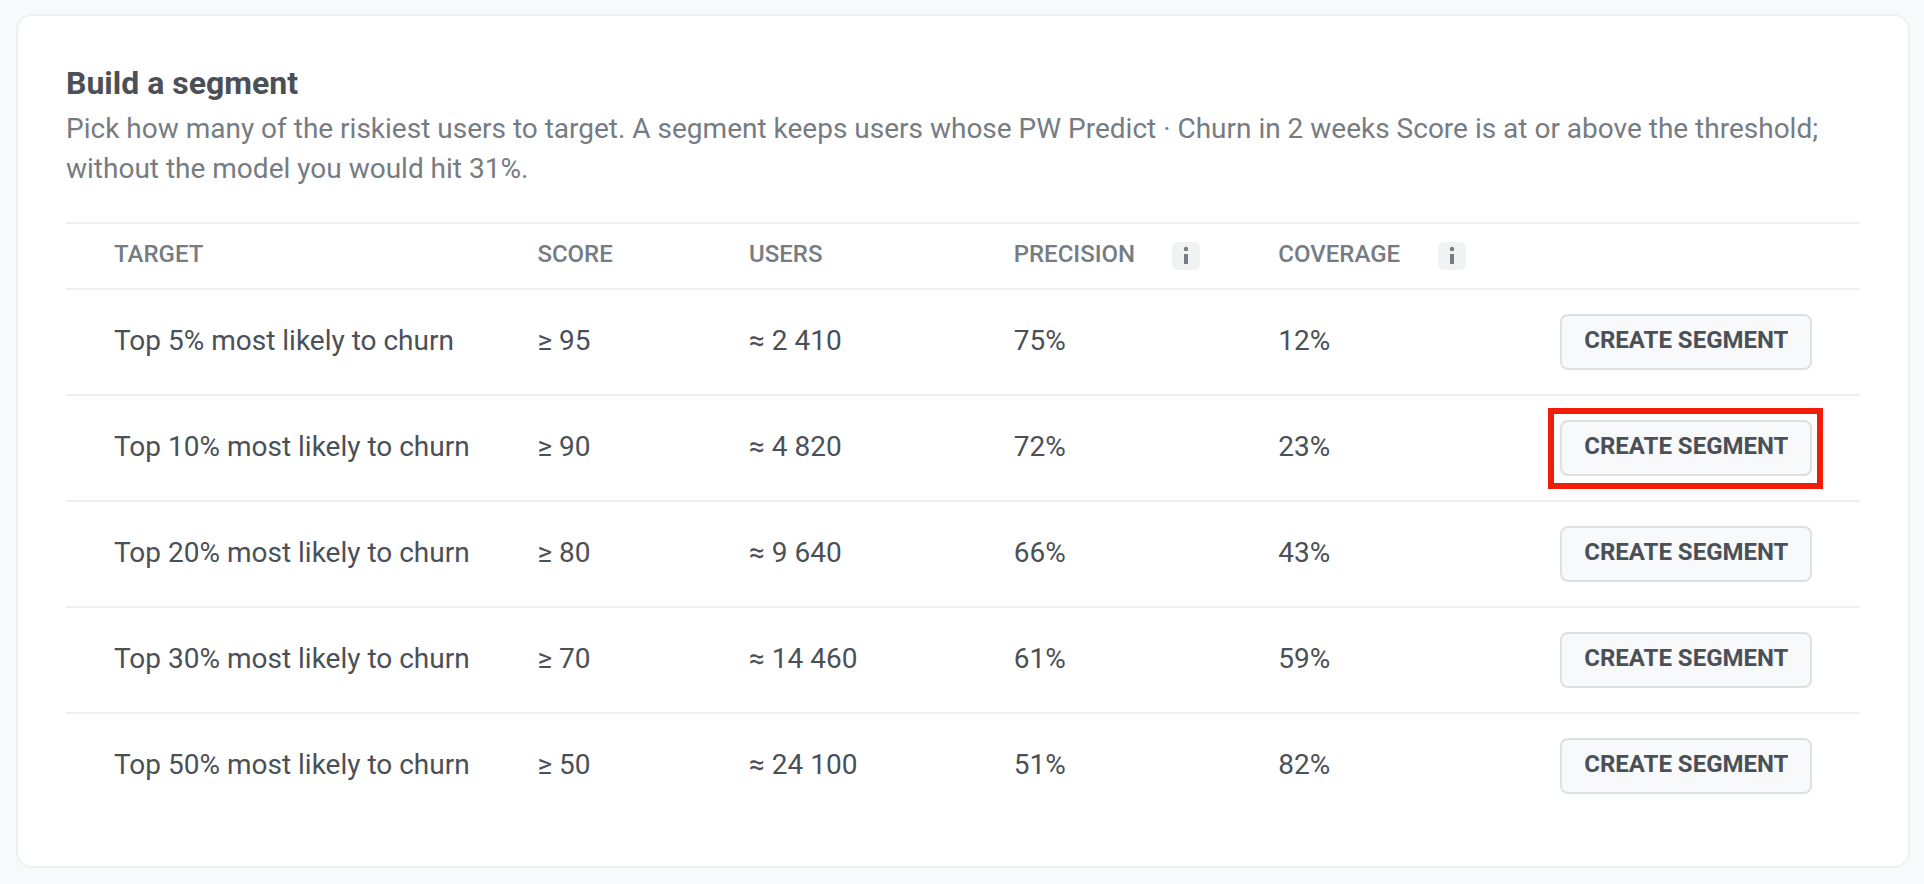
- Keep the suggested name, for example
Churn in 2 weeks · score 90+, or enter your own. - Click Create.
The segment is a regular segment with one condition on the score tag. Use it in campaigns and journeys like any other segment.
Use prediction tags in segments and journeys
Anchor link toThe prediction tags work like any other user tags. To target users by prediction without the Build a segment table, create a segment by tags:
- By score: compare the
… Scoretag with a number, for example users with a score of 80 or higher. - By category: select users whose
… Categorytag ishighorvery_high.
In Customer Journey, use these segments in an Audience-based entry to start a journey for at-risk users, or in a Segment split to send at-risk users down a separate branch. Tags update every night, so a user can enter or leave the segment from one day to the next.
Pause or delete a prediction
Anchor link toTo manage a prediction, click the menu icon in its row on the Predictions page:
- Pause stops daily scoring. Resume starts it again.
- Delete removes the prediction. Pushwoosh removes its two tags from all users overnight.
Plan and limits
Anchor link toPredictions are available when your plan includes them. Without them, the Predictions page shows this banner and no Create prediction button:

An account can have up to 3 predictions across all its apps, unless your plan sets a different limit. When the account reaches the limit, the page shows how many predictions are in use and hides Create prediction. To create a new prediction, delete an existing one. To raise the limit, contact your account manager.