Statistiques des éléments de Journey
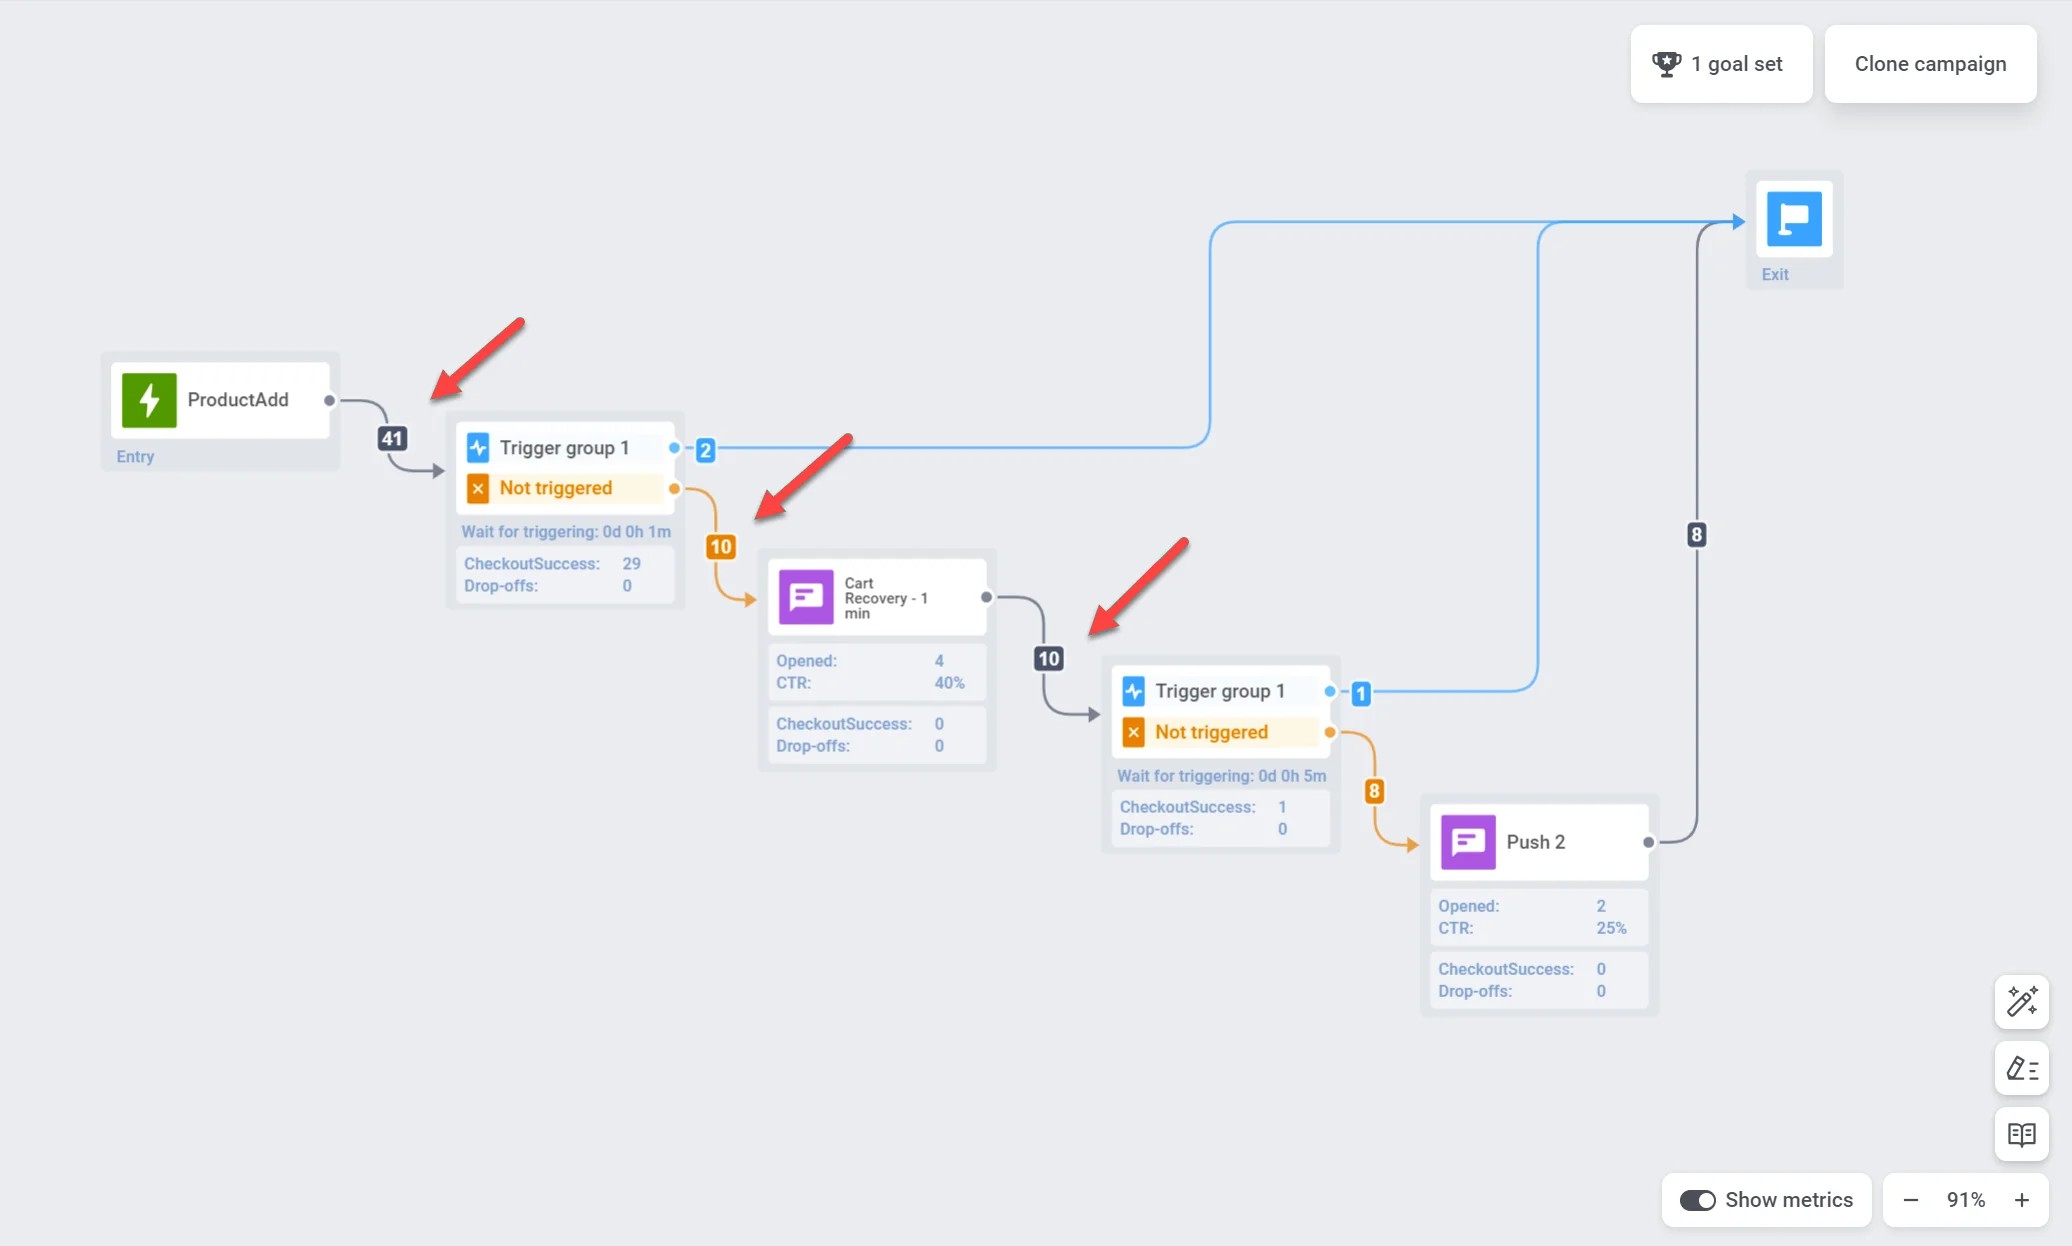
Pour afficher les métriques de chaque élément de Journey sur le canevas, activez l’option Afficher les métriques en bas du canevas. Vous pouvez également survoler l’élément pour afficher les métriques.
Progression de l’audience
Anchor link toPushwoosh vous permet de suivre votre audience au fur et à mesure de sa progression dans le Journey grâce à une visualisation en temps réel sur le canevas. Un nombre sur la flèche suivant chaque élément de Journey indique le nombre total de clients qui ont terminé cette étape particulière.
Statistiques pour chaque point de communication
Anchor link toVous pouvez obtenir des informations sur les performances de chaque point de communication grâce à des métriques telles que :
Notifications push et e-mails
Anchor link to| Objectifs atteints | Indique le nombre d’utilisateurs qui ont atteint l’objectif de conversion à ce point précis. |
| Ouverts | Affiche le nombre de fois où le message a été ouvert par les utilisateurs. |
| CTR | Représente le pourcentage d’utilisateurs qui ont cliqué sur le message. |
| Abandons | Représente le nombre de messages qui n’ont pas pu être envoyés pour une raison quelconque (par exemple, un jeton push expiré ou une adresse e-mail invalide). |
| Sortis par objectifs de conversion ou événements d’annulation | Nombre d’utilisateurs qui ont quitté le Journey à ce point en raison de l’atteinte d’un objectif de conversion ou du déclenchement d’un événement d’annulation. |
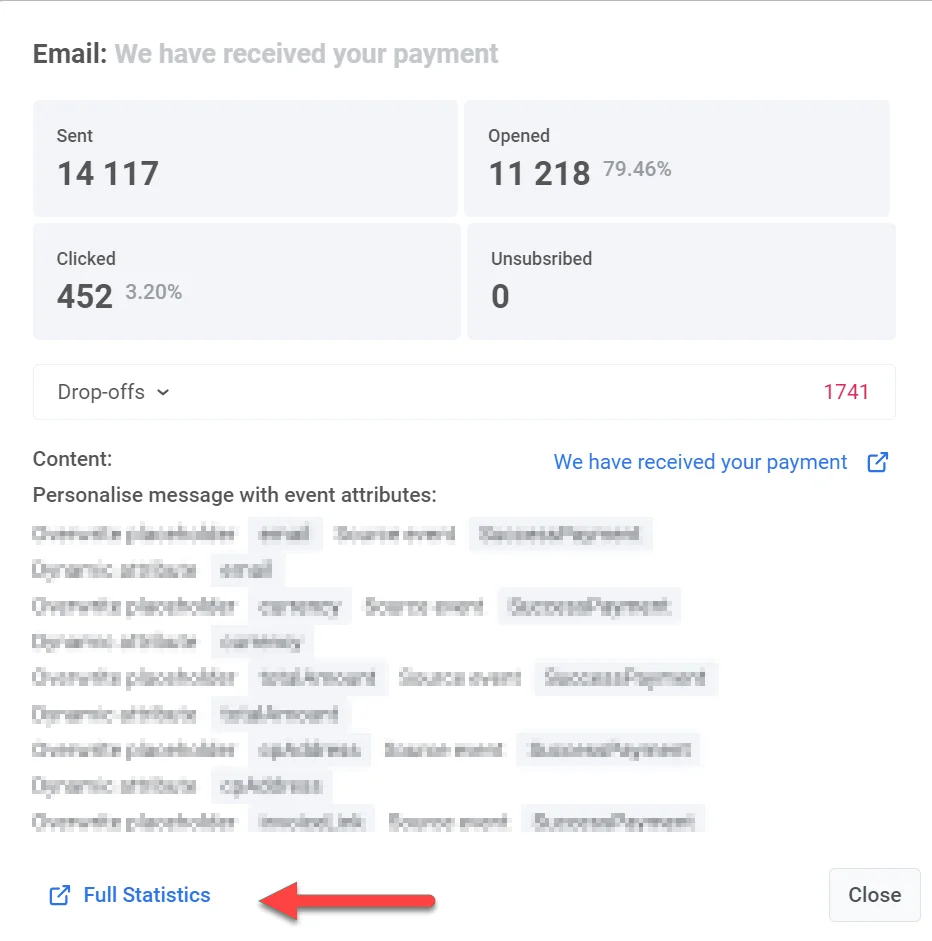
Pour obtenir des informations plus détaillées sur l’efficacité de chaque message, double-cliquez sur un élément de message sur le canevas. Une fenêtre de statistiques détaillées s’ouvrira, affichant les métriques clés du message telles que :
- le nombre de messages envoyés
- le nombre de messages ouverts
- le taux de conversion
- le nombre d’entrées
- le nombre d’abandons,
- le nombre de clics, etc.
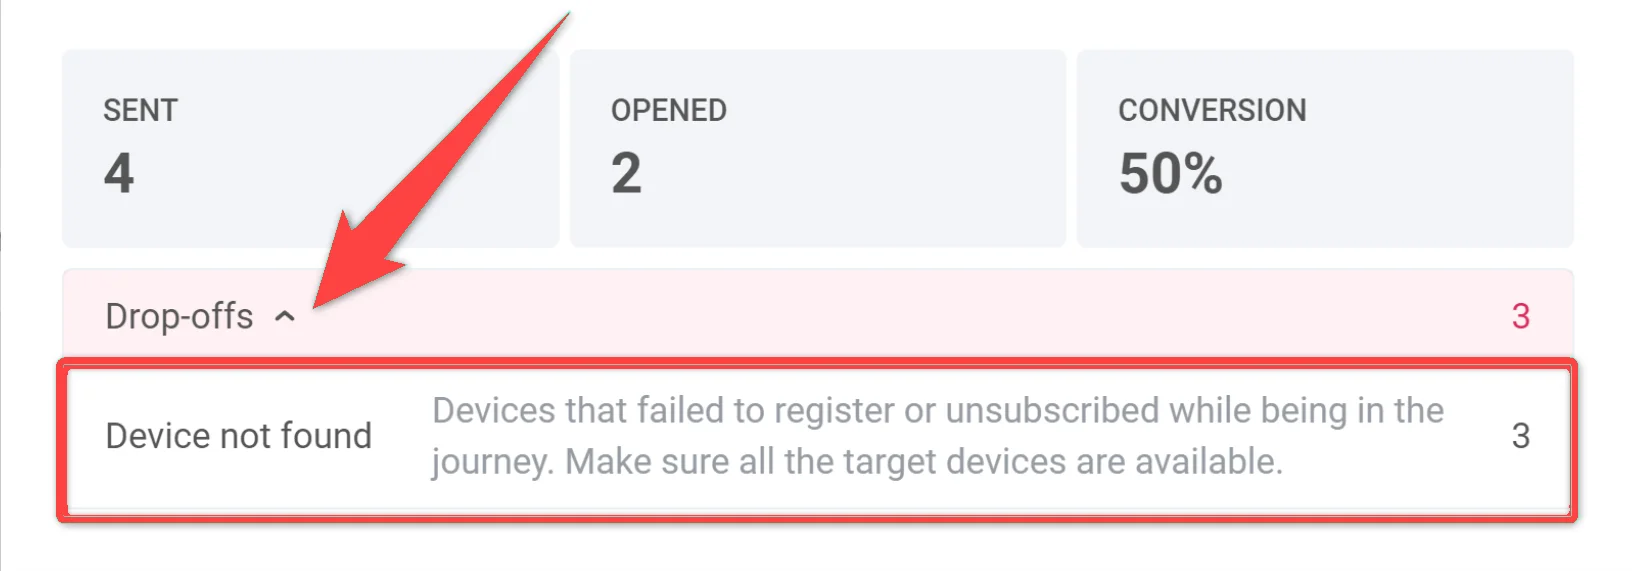
Pour voir les raisons des abandons et le nombre d’abandons pour chaque cause, développez le bloc Abandon.
Pour accéder à des statistiques encore plus complètes pour un message, cliquez sur Statistiques détaillées en bas de la fenêtre.
In-apps
Anchor link to| Objectifs atteints | Indique le nombre d’utilisateurs qui ont atteint l’objectif de conversion à ce point précis. |
| Abandons | Représente le nombre de messages in-app qui n’ont pas pu être affichés aux utilisateurs. |
Pour une compréhension plus détaillée des performances de votre message in-app, double-cliquez sur l’élément de message, puis, dans la fenêtre qui apparaît, cliquez sur le nom du Rich media. Cela ouvrira des statistiques complètes sur le message.
| Objectifs atteints | Indique le nombre d’utilisateurs qui ont atteint l’objectif de conversion à ce point précis. |
| Envoyés | Indique le nombre de messages envoyés. |
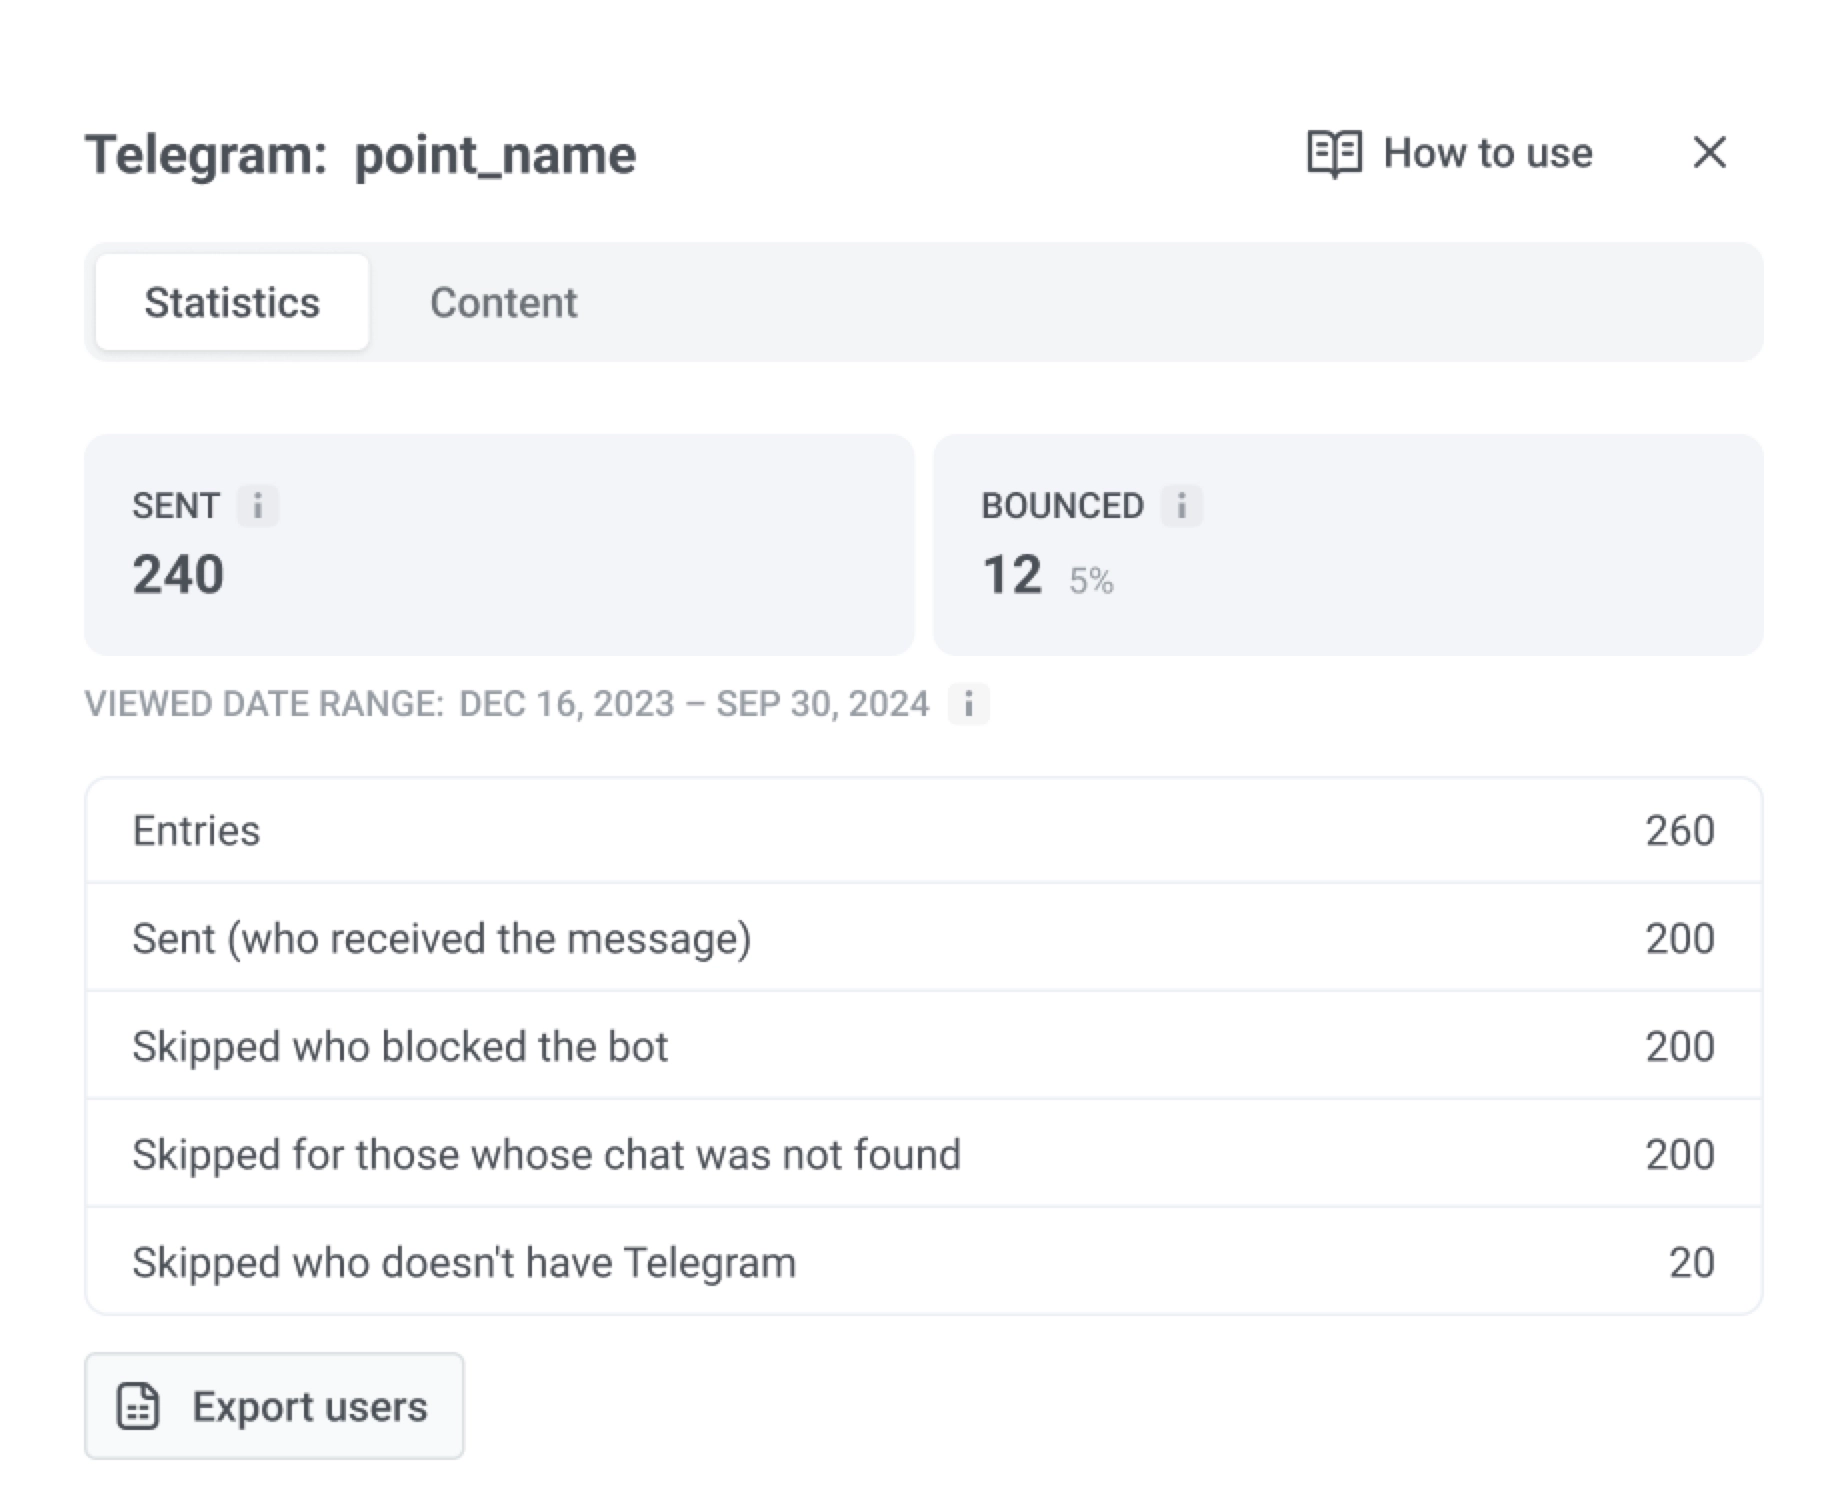
Telegram
Anchor link to| Envoyés | Indique le nombre de messages Telegram envoyés. |
| Rejetés | Indique le nombre de messages Telegram qui n’ont pas pu être livrés. |
| Entrées | Indique le nombre d’utilisateurs qui ont atteint l’élément Telegram. |
| Envoyés (qui a reçu le message) | Indique le nombre d’utilisateurs qui ont reçu avec succès le message Telegram. |
Vous pouvez également consulter la Plage de dates consultée : depuis le début et cliquer sur Exporter les utilisateurs.
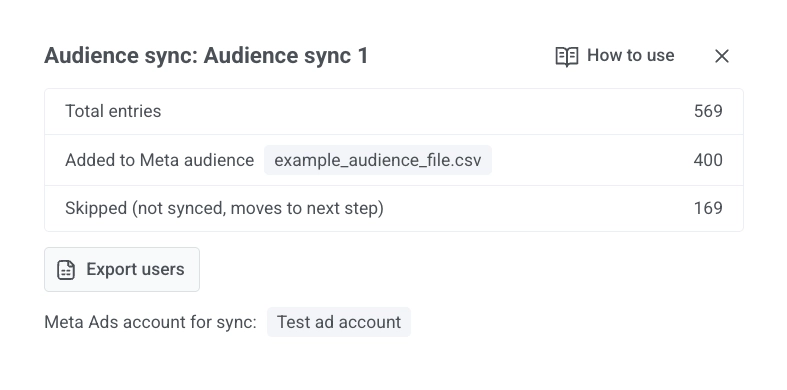
Synchronisation d’audience
Anchor link toPour un élément Synchronisation d’audience, la vue des statistiques inclut :
| Total des entrées | Indique combien d’utilisateurs ont atteint cette étape du Journey. |
| Ajoutés à l’audience Meta | Indique combien d’utilisateurs Meta a fait correspondre et ajoutés à l’audience que vous avez sélectionnée. |
| Retirés de l’audience Meta | Indique combien d’utilisateurs Meta a fait correspondre et retirés de l’audience que vous avez sélectionnée. |
| Ignorés (non synchronisés, passent à l’étape suivante) | Indique combien d’utilisateurs n’ont pas été synchronisés. Ils continuent vers l’étape suivante du Journey. |
Vous pouvez Exporter les utilisateurs depuis cette vue. L’écran montre également quel compte Meta Ads a été utilisé pour la synchronisation.
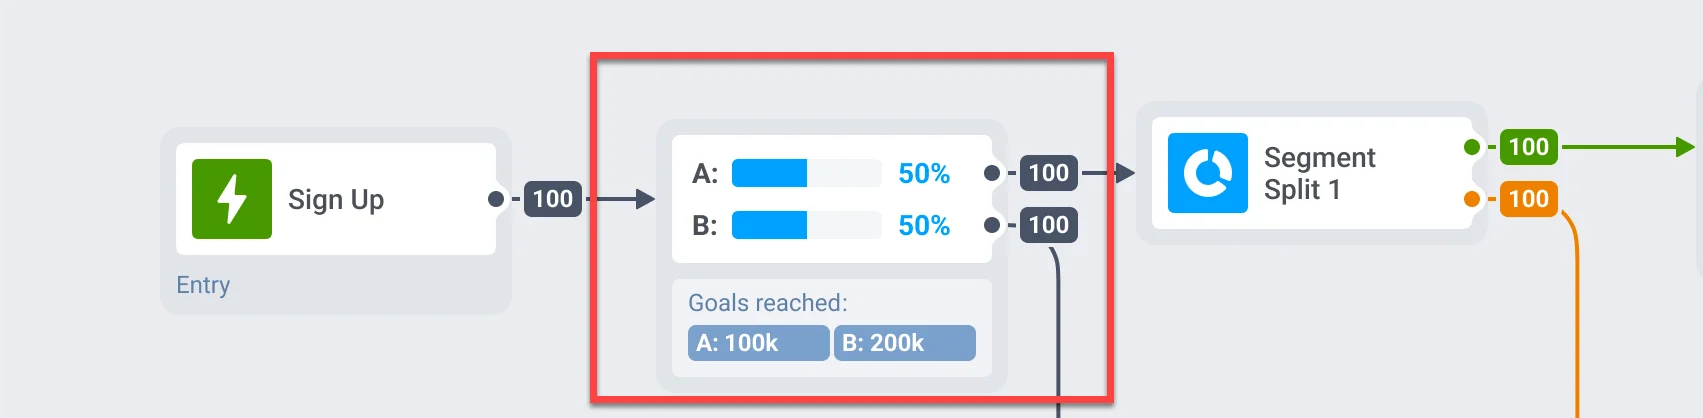
Statistiques des tests A/B/n
Anchor link toSi vous effectuez des tests A/B/n sur différents éléments de votre Customer Journey, vous pouvez rapidement identifier la variante la plus performante de chaque élément.
Toujours en attente
Anchor link toLa métrique Toujours en attente dans Pushwoosh Customer Journey s’applique aux étapes Délai et Attendre le déclencheur. Elle aide à surveiller le flux d’utilisateurs, à identifier les retards et à optimiser la configuration de votre Customer Journey.
Attendre le déclencheur
Anchor link toAffiche le nombre d’utilisateurs qui attendent actuellement de déclencher un événement spécifique. Ces utilisateurs sont entrés dans l’étape mais n’ont pas encore rempli les conditions requises dans la période d’attente définie.
Délai
Anchor link toReflète les utilisateurs qui sont encore dans la période d’attente avant de passer à l’étape suivante.
Exporter les statistiques pour chaque étape de votre Customer Journey
Anchor link toVous pouvez exporter les utilisateurs qui sont passés par chaque étape de votre Customer Journey, y compris des éléments comme les notifications push, les e-mails, les messages in-app, Attendre le déclencheur, Division par condition, etc. Cela vous permet d’analyser les performances des éléments de campagne individuels.
Pour exporter les statistiques :
- Ouvrez la campagne que vous souhaitez suivre dans le Customer Journey Builder.
- Cliquez sur l’étape spécifique du Journey pour laquelle vous souhaitez exporter des statistiques.
- Cliquez sur Exporter les statistiques.
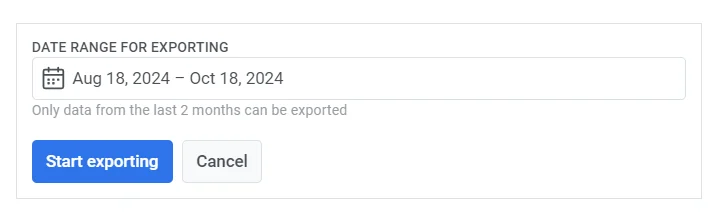
- Spécifiez la plage de dates pour les données que vous souhaitez exporter et cliquez sur Démarrer l’exportation.
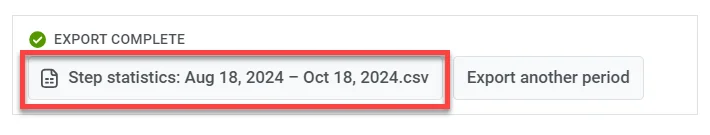
- Une fois le processus d’exportation terminé, Pushwoosh affichera un message de confirmation. Cliquez sur le fichier pour télécharger les données exportées, ou choisissez d’exporter une autre période si nécessaire.