Holdout Split
Holdout Split एलिमेंट का उपयोग करके journey के बाकी हिस्से से उपयोगकर्ताओं के एक हिस्से को रोकें, फिर उनके गोल पूरा होने की तुलना उन सभी से करें जो उस बिंदु के आगे बढ़े। अकाउंट-वाइड कंट्रोल ग्रुप के विपरीत, जो प्रति एप्लिकेशन फिक्स्ड है और हर जगह मार्केटिंग संदेशों को ब्लॉक करता है, Holdout Split केवल एक journey के अंदर, उसके फ्लो के एक बिंदु पर लागू होता है।
Holdout Split का उपयोग कब करें
Anchor link to- एक चुने हुए बिंदु पर एक journey के प्रभाव को मापें। इस बिंदु तक पहुंचने वाले उपयोगकर्ताओं के एक हिस्से को रोकें और देखें कि क्या इसके बाद के चरण उन चरणों को छोड़ने की तुलना में आपके कन्वर्जन गोल्स को अधिक आगे बढ़ाते हैं।
- किसी विशिष्ट सेगमेंट या फ्लो का परीक्षण करें। अपने पूरे एप्लिकेशन को रोकने के बजाय केवल इस कैंपेन के लिए महत्वपूर्ण उपयोगकर्ताओं के लिए प्रभाव मापने हेतु Holdout Split को ऑडियंस-आधारित एंट्री या ट्रिगर-आधारित एंट्री के साथ मिलाएं।
- सिर्फ इवेंट काउंट नहीं, बल्कि प्रति-गोल अपलिफ्ट प्राप्त करें। यदि journey में कई कन्वर्जन गोल्स हैं, तो Holdout Split प्रत्येक के लिए अलग से अपलिफ्ट और सांख्यिकीय महत्व की रिपोर्ट करता है।
उदाहरण के लिए, Holdout Split को एंट्री के बाद और अपने ऑनबोर्डिंग संदेशों से पहले रखें। In journey पर जारी रखने वाले उपयोगकर्ताओं के लिए एक खरीद कन्वर्जन गोल की तुलना Holdout पर मौजूद उपयोगकर्ताओं से करें, जो वहां बाहर निकल जाते हैं और इस journey से कुछ और नहीं पाते।
पूर्वापेक्षाएं
Anchor link toयदि आप अपलिफ्ट रिपोर्ट में आंकड़े चाहते हैं, तो journey के लिए कम से कम एक कन्वर्जन गोल परिभाषित करें। आप बिना किसी गोल के भी Holdout Split को रख और सहेज सकते हैं। इसके बिना, रिपोर्ट दरों और अपलिफ्ट के बजाय गोल जोड़ने का संकेत दिखाती है।
Holdout Split जोड़ें और कॉन्फ़िगर करें
Anchor link to-
Holdout Split एलिमेंट को कैनवास पर उस जगह रखें जहां से आप journey के बाकी हिस्से को मापना शुरू करना चाहते हैं (जिन संदेशों या चरणों का आप परीक्षण कर रहे हैं, उनसे पहले)।
-
इसकी सेटिंग खोलने के लिए एलिमेंट पर डबल-क्लिक करें।
-
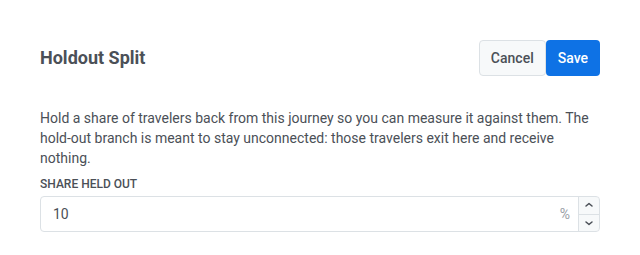
Share held out सेट करें: इस बिंदु तक पहुंचने वाले उपयोगकर्ताओं का वह प्रतिशत जिन्हें Holdout शाखा में भेजा जाता है। बाकी In journey शाखा पर जारी रहते हैं। Share held out 1–20% स्वीकार करता है।
-
कैनवास पर शाखाओं को कनेक्ट करें:
- Holdout शाखा को अनकनेक्टेड छोड़ दें। उस शाखा पर उपयोगकर्ता तुरंत journey से बाहर निकल जाते हैं और इससे कुछ और नहीं पाते।
- In journey शाखा को अपने बाकी फ्लो से कनेक्ट करें।
-
Save पर क्लिक करें।
सहेजने के बाद, आपको एलिमेंट से दो शाखाएं दिखनी चाहिए: Holdout जिसका कोई अगला चरण नहीं है, और In journey जो आपके द्वारा कनेक्ट किए गए फ्लो में ले जाती है।

अपलिफ्ट रिपोर्ट जांचें
Anchor link toGoal uplift vs holdout का उपयोग एक सवाल का जवाब देने के लिए करें: क्या इस बिंदु के बाद के चरण उन उपयोगकर्ताओं की तुलना में आपके कन्वर्जन गोल्स को बढ़ाते हैं जो यहां रुक गए?
-
चल रही journey खोलें।
-
Holdout Split बिंदु खोलें और वर्तमान विभाजन के नीचे Goal uplift vs holdout खोजें।
-
यदि आपको दरों के बजाय एक प्लेसहोल्डर दिखे, तो अगले दिन वापस आएं। Pushwoosh दिन में एक बार रिपोर्ट को रीफ्रेश करता है, और journey शुरू होने के अगले दिन पहले आंकड़े दिखाई देते हैं।
-
दरों पर भरोसा करने से पहले, रिपोर्ट हेडर में नमूना आकार और समय की जांच करें:
- अंतिम रीफ्रेश पर In journey और Holdout पर कितने उपयोगकर्ता थे
- एट्रिब्यूशन विंडो (बिंदु के कितने दिनों बाद तक एक गोल पूरा होना गिना जाता है)
- रिपोर्ट की गणना आखिरी बार कब की गई थी
एक बहुत छोटा holdout नमूना अपलिफ्ट को अस्थिर बना देता है, भले ही इन-जर्नी दर मजबूत दिखे।
-
प्रत्येक कन्वर्जन गोल के लिए, शाखाओं की तुलना करें, फिर अपलिफ्ट और महत्व पढ़ें:
- Conversion, in journey की तुलना Conversion, holdout (दर और गिनती) से करें। यह उन उपयोगकर्ताओं के बीच का अंतर है जिन्हें journey का बाकी हिस्सा मिला और उन उपयोगकर्ताओं के बीच जिन्हें इस बिंदु के बाद इससे कुछ और नहीं मिला।
- उस अंतर के लिए Uplift को एक सापेक्ष परिवर्तन के रूप में पढ़ें। सकारात्मक अपलिफ्ट का मतलब है कि इन-जर्नी शाखा ने holdout से बेहतर कन्वर्ट किया। यदि इस गोल के लिए holdout में शून्य कन्वर्जन थे, तो अपलिफ्ट — दिखाता है (सापेक्ष अंतर के लिए कोई आधार नहीं)।
- अपलिफ्ट को एक निर्णय के रूप में मानने से पहले महत्व बैज पढ़ें:
- Significant: शाखाओं के बीच का अंतर वास्तविक है, यादृच्छिक नहीं। अपलिफ्ट संख्या पर भरोसा करें।
- Not significant: Pushwoosh के पास पर्याप्त डेटा है, लेकिन अंतर विश्वसनीय नहीं है। अभी इस अपलिफ्ट संख्या पर कार्रवाई न करें।
- Not enough data: किसी भी तरह से बताने के लिए अब तक बहुत कम कन्वर्जन हैं। बड़े नमूने के लिए journey को चलते रहने दें।
सभी Holdout Split को एक ही जगह पर समीक्षा करने के लिए, journey का कैंपेन हेल्थ डैशबोर्ड खोलें और प्रत्येक बिंदु के लिए वही रिपोर्ट जांचें।
प्रत्येक Holdout Split बिंदु का अपलिफ्ट CSV फ़ाइल के रूप में, प्रति मुद्रा राजस्व के साथ पाने के लिए, API के ज़रिए अपलिफ्ट रिपोर्ट निर्यात करें।
प्रत्येक शाखा से उपयोगकर्ताओं को निर्यात करें
Anchor link toएक चल रही journey में कौन से उपयोगकर्ता Holdout में गए और कौन से In journey में गए, इसकी एक सूची डाउनलोड करें।
Export users के लिए आपकी भूमिका में Personal data अनुमति आवश्यक है।
-
चल रही journey खोलें।
-
Holdout Split बिंदु खोलें।
-
Goal uplift vs holdout के नीचे Export users पर क्लिक करें।
-
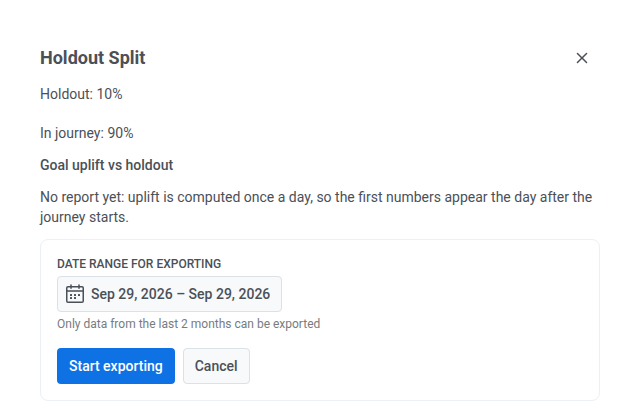
तारीख सीमा सेट करें। आप केवल पिछले 2 महीनों का डेटा ही निर्यात कर सकते हैं।
-
Start exporting पर क्लिक करें।
-
फ़ाइल तैयार होने पर, उसी पैनल में एक डाउनलोड बटन दिखाई देता है। CSV प्राप्त करने के लिए उस पर क्लिक करें।
प्रत्येक पंक्ति में एक उपयोगकर्ता ID और उस उपयोगकर्ता द्वारा ली गई शाखा, holdout या journey, सूचीबद्ध होती है। यदि उस तारीख सीमा में कोई भी उस बिंदु तक नहीं पहुंचा, तो फ़ाइल में केवल हेडर पंक्ति होती है।
यदि आपको प्रति-journey के बजाय अकाउंट-वाइड holdout की आवश्यकता है, तो कंट्रोल ग्रुप्स का उपयोग करें।