App Inbox পরিসংখ্যান
App Inbox পরিসংখ্যান দেখায় কতজন মানুষ আসলেই মেসেজ পেয়েছেন, কতজন এটি খুলেছেন, এবং কতজন এতে ট্যাপ করেছেন, সাথে এটাও দেখায় যে পথের মধ্যে কোথায় আপনি বাকিদের হারাচ্ছেন।
App Inbox পরিসংখ্যান খুলুন
Anchor link to- journey ক্যানভাসে App Inbox এলিমেন্টে ডাবল-ক্লিক করুন।
- এই এলিমেন্টের জন্য প্যানেলের মেট্রিক্স চেক করুন। নিচে ক্যানভাসে মেট্রিক্স দেখুন।
- Overview, Timeline এবং Errors ট্যাবসহ সম্পূর্ণ Message stats পেজ খুলতে Detail statistics-এ ক্লিক করুন।
ক্যানভাসে মেট্রিক্স
Anchor link toএই প্যানেল খুলতে journey ক্যানভাসে App Inbox এলিমেন্টে ডাবল-ক্লিক করুন। এটি মানুষ গণনা করে, মেসেজ নয়, যা নিচের বিস্তারিত পরিসংখ্যান খোলার আগে আপনাকে ডেলিভারি ও এনগেজমেন্টের একটি দ্রুত ধারণা দেয়।
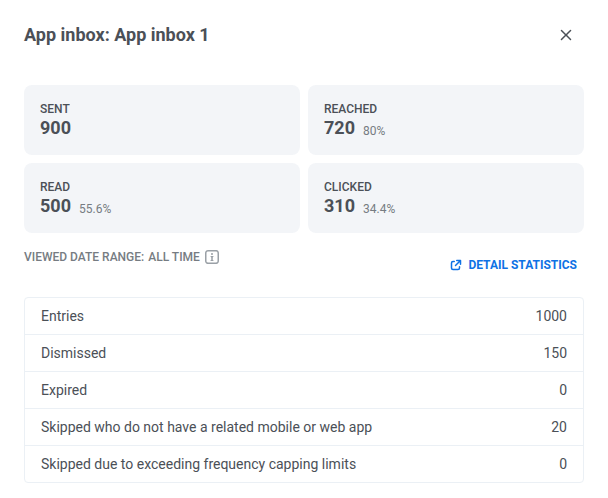
| মেট্রিক | এর অর্থ |
|---|---|
| Entries | যাদের কাছে এই এলিমেন্ট পৌঁছানোর চেষ্টা করেছে, তারা সবাই। |
| Sent | যাদের ইনবক্সে মেসেজ পৌঁছেছে। |
| Reached | যাদের ইনবক্সে মেসেজ আছে। এটি তখন দেখা যায় যখন তারা অ্যাপ খোলেন, এমনকি তারা এখনও এটি না দেখলেও। |
| Read | যারা মেসেজ খুলে দেখেছেন। |
| Clicked | যারা মেসেজে ট্যাপ করেছেন। |
| Dismissed | যারা মেসেজ মুছে ফেলেছেন, তারা আগে এটি পড়েছেন কি না তা নির্বিশেষে। |
| Expired | যাদের মেসেজ পড়ার আগেই অদৃশ্য হয়ে গেছে। বেশি সংখ্যার অর্থ হলো মানুষের আরও সময় দরকার। দীর্ঘ expiration চেষ্টা করুন। |
| Skipped (no app) | যাদের ইনবক্স দেখানোর জন্য কোনো মোবাইল বা ওয়েব অ্যাপ সেট আপ নেই, তাই মেসেজের যাওয়ার কোনো জায়গা ছিল না। |
| Frequency capping skipped | যারা ইতিমধ্যে তাদের App Inbox সীমায় পৌঁছেছেন, তাই এই মেসেজটি ডেলিভার হয়নি। |
বিস্তারিত পরিসংখ্যান
Anchor link toএই App Inbox এলিমেন্টটি অডিয়েন্স থেকে ক্লিক পর্যন্ত কেমন পারফর্ম করেছে তা পরীক্ষা করতে Message stats ব্যবহার করুন।
Overview ট্যাব
Anchor link toএই এলিমেন্টের ডেলিভারি এবং এনগেজমেন্ট পরীক্ষা করতে Overview ট্যাব ব্যবহার করুন।
Campaign performance
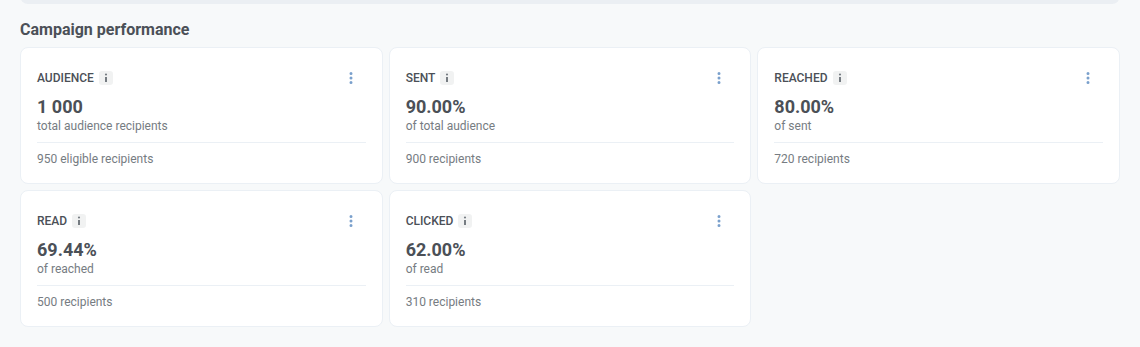
Anchor link toএই কার্ডগুলি সংক্ষেপে দেখায় যে এই App Inbox এলিমেন্টটি কেমন পারফর্ম করেছে।
| কার্ড | কী দেখায় | সূত্র |
|---|---|---|
| Audience | এই এলিমেন্টের জন্য মোট অডিয়েন্স ব্যবহারকারী, এবং বাদ দেওয়ার (frequency capping বা একটি কন্ট্রোল গ্রুপ) পরে কতজন যোগ্য থেকে গেছেন। | যোগ্য ব্যবহারকারী + বাদ দেওয়া ব্যবহারকারী |
| Sent | মোট অডিয়েন্সের যে অংশ তাদের ইনবক্সে মেসেজ পেয়েছেন। | ইনবক্সে রাখা হয়েছে ÷ মোট অডিয়েন্স |
| Reached | পাঠানো ব্যবহারকারীদের যে অংশের অ্যাপ অন্তত একবার মেসেজ পেয়েছে। এটি তাদের ডিভাইসে আছে, কিন্তু তারা হয়তো এখনও এটি দেখেননি। | Reached ÷ sent |
| Read | পৌঁছানো ব্যবহারকারীদের যে অংশ মেসেজ খুলেছেন, তারা পরে এটি মুছে ফেলুক বা না ফেলুক। | Read ÷ reached |
| Clicked | পড়া ব্যবহারকারীদের যে অংশ মেসেজে ট্যাপ করেছেন। বারবার ট্যাপ একবার গণনা হয়। | Clicked ÷ read |
Campaigns distribution
Anchor link toCampaigns distribution দেখায় যে ব্যবহারকারীরা ফানেলের মধ্য দিয়ে কীভাবে যায়। ব্লকের হেডারে থাকা ড্রপডাউন দিয়ে Funnel view ও Table view-এর মধ্যে সুইচ করুন।
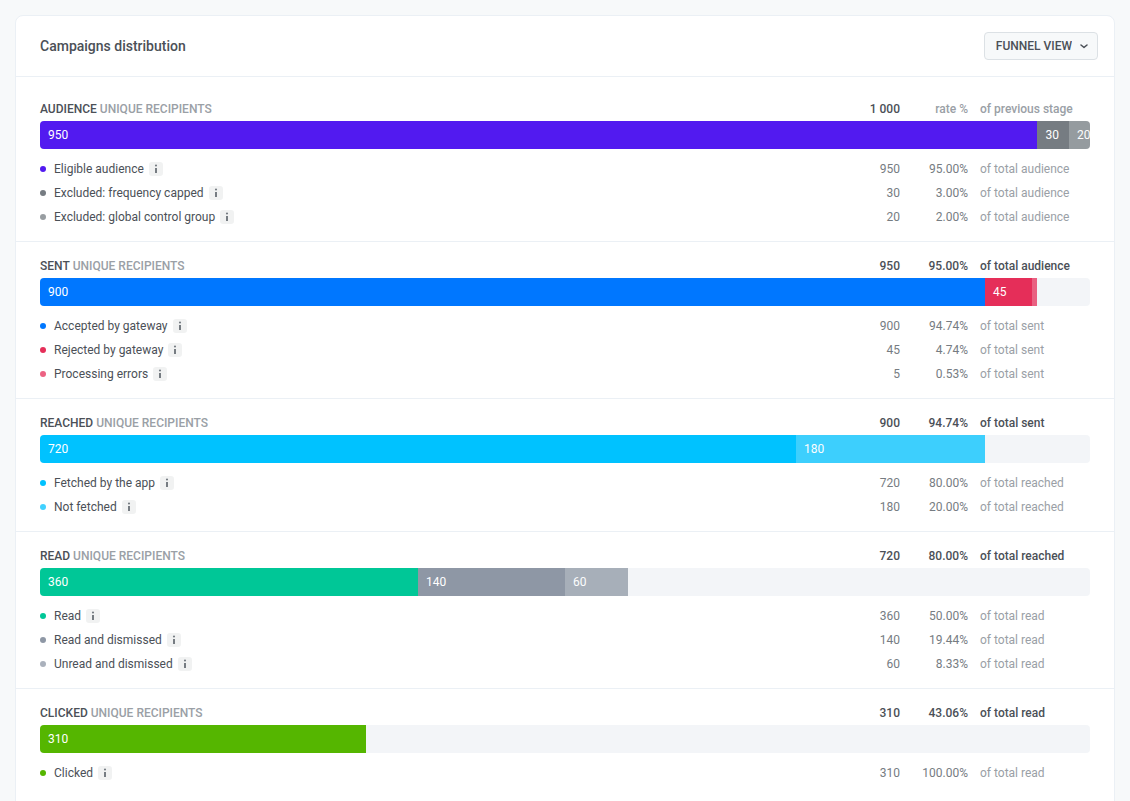
প্রতিটি সারি দেখায় কতজন মানুষ সেই ধাপে পৌঁছেছেন, এবং কেন কেউ কেউ পরের ধাপে যাননি:
| ধাপ | এর অর্থ |
|---|---|
| Audience | এই এলিমেন্ট যাদের লক্ষ্য করেছিল, তারা সবাই। কিছু কিছু কিছু পাঠানোর আগেই বাদ পড়ে: তারা ইতিমধ্যে তাদের frequency capping সীমায় পৌঁছেছেন, অথবা তারা একটি গ্লোবাল কন্ট্রোল গ্রুপে আছেন। |
| Sent | প্রায় সব যোগ্য ব্যবহারকারীই তাদের ইনবক্সে মেসেজ পান। কেউ কেউ পান না, সাধারণত একটি খারাপ ডিভাইস বা টোকেন, বা একটি ডেলিভারি এরর-এর কারণে। কারণ জানতে Errors ট্যাব দেখুন। |
| Reached | বেশিরভাগ পাঠানো মেসেজ ঠিক সেই মুহূর্তে গ্রহণ করা হয় যখন ব্যবহারকারী অ্যাপ খোলেন। বাকিরা শুধু অপেক্ষা করছেন: তাদের অ্যাপ এখনও মেসেজটি আনেনি, যা কোনো ডেলিভারি ব্যর্থতা নয়। |
| Read | বেশিরভাগ পৌঁছানো মেসেজ খোলা হয়। কিছু মানুষ না পড়েই মেসেজ মুছে ফেলেন, এবং কিছু মানুষ পড়ে তারপর মুছে ফেলেন। যেভাবেই হোক, একবার মুছে ফেলা হলে তা অপঠিত হিসেবে গণনা হবে না। |
| Clicked | মেসেজ পড়া কিছু মানুষ এতে ট্যাপ করা পর্যন্ত এগিয়ে যান। বারবার ট্যাপ একবার গণনা হয়, ঠিক যেভাবে Read বারবার খোলাকে একবার গণনা করে। |
Timeline ট্যাব
Anchor link toএই মেসেজের পরে আসা কাস্টম ইভেন্টগুলি দেখতে Timeline ট্যাব ব্যবহার করুন। App Inbox-এর কোনো ডেলিভারি চার্ট নেই, তাই ট্যাবটি তার জায়গায় No delivery chart for App Inbox এবং তার নিচে Events টেবিল দেখায়। টেবিলটি কোন ইভেন্টগুলি গণনা করবে তা বেছে নিতে ট্যাবের উপরে সময়কাল সেট করুন।
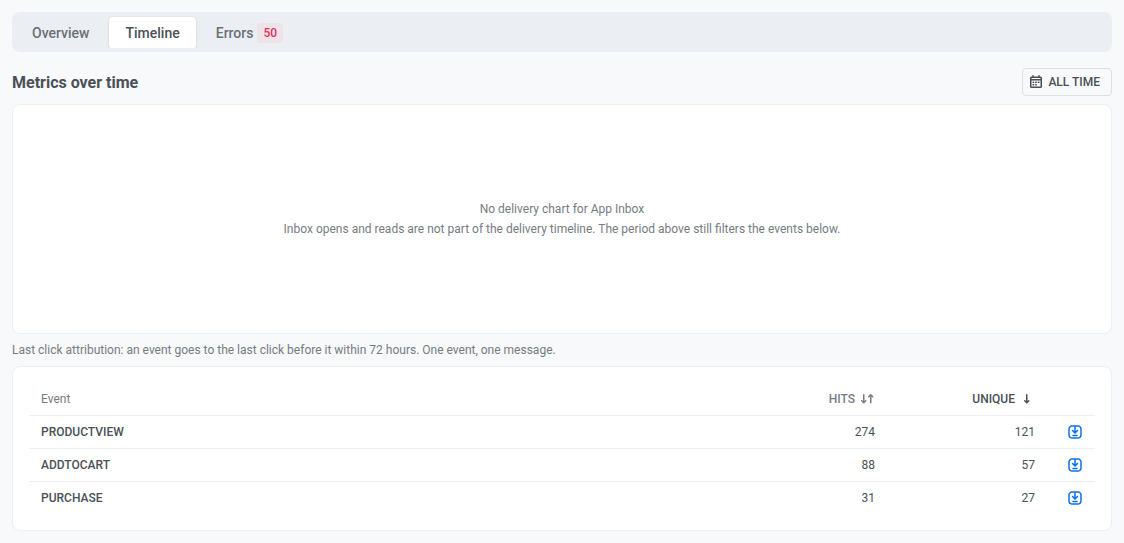
এই মেসেজ খোলার পরে কাস্টম ইভেন্ট
Anchor link toEvents টেবিলটি ব্যবহারকারীরা ইনবক্সে এই মেসেজটি খোলার পরে আপনার অ্যাপ যে কাস্টম ইভেন্টগুলি পাঠিয়েছে তা দেখায়। এটি কেবল তখনই পূরণ হয় যখন আপনার অ্যাপ Pushwoosh-এ ইভেন্ট পাঠায়।
প্রতিটি ইভেন্ট সেই মেসেজে যায় যেটিতে ব্যবহারকারী ইভেন্টের আগের ৭২ ঘণ্টার মধ্যে শেষবার ক্লিক করেছেন:
- কোনটি ক্লিক হিসেবে গণনা হয়: মেসেজ খোলা।
- অন্যান্য মেসেজে ক্লিক: একই অ্যাপের সমস্ত মেসেজের ক্লিক গণনা করা হয়, তাই পরবর্তী কোনো মেসেজে ক্লিকের পরে আসা ইভেন্ট সেই পরবর্তী মেসেজে যায়, এটিতে নয়।
- সীমা: একটি ইভেন্ট কেবল একটি মেসেজেই যায়।
| কলাম | কী দেখায় |
|---|---|
| ইভেন্ট | ইভেন্টের নাম। |
| হিটস | এই মেসেজে কতগুলি ইভেন্ট গেছে। মেসেজটি খোলার পরে ব্যবহারকারী যে প্রতিটি ইভেন্ট পাঠান তা গণনা করা হয়, যতক্ষণ না ব্যবহারকারী অন্য কোনো মেসেজে ক্লিক করেন বা ৭২ ঘণ্টা পেরিয়ে যায়। |
| ইউনিক | কতজন স্বতন্ত্র ব্যবহারকারী অন্তত একবার ইভেন্টটি পাঠিয়েছেন। |
ইভেন্টগুলি মেসেজের সাথে ডিভাইস দ্বারা নয়, User ID দ্বারা মেলানো হয়।
সময়কাল ওপেন নয়, ইভেন্টগুলি ফিল্টার করে। সময়কাল শুরুর আগের একটি ওপেন এখনও সময়কালের ভিতরের কোনো ইভেন্টের জন্য গণনা করা হয়। প্রতিটি সারিতে একটি এক্সপোর্ট আইকন রয়েছে, যা একই নিয়মে গণনা করা সেই সারির পিছনের ডিভাইসগুলি CSV হিসাবে ডাউনলোড করে।
Errors ট্যাব
Anchor link toErrors এই এলিমেন্টের প্রতিটি ডেলিভারি এরর তালিকাভুক্ত করে, প্ল্যাটফর্ম অনুযায়ী গ্রুপ করা, প্রেরকের নিজস্ব এরর নাম এবং সেই প্ল্যাটফর্মের পাঠানোর অংশসহ।
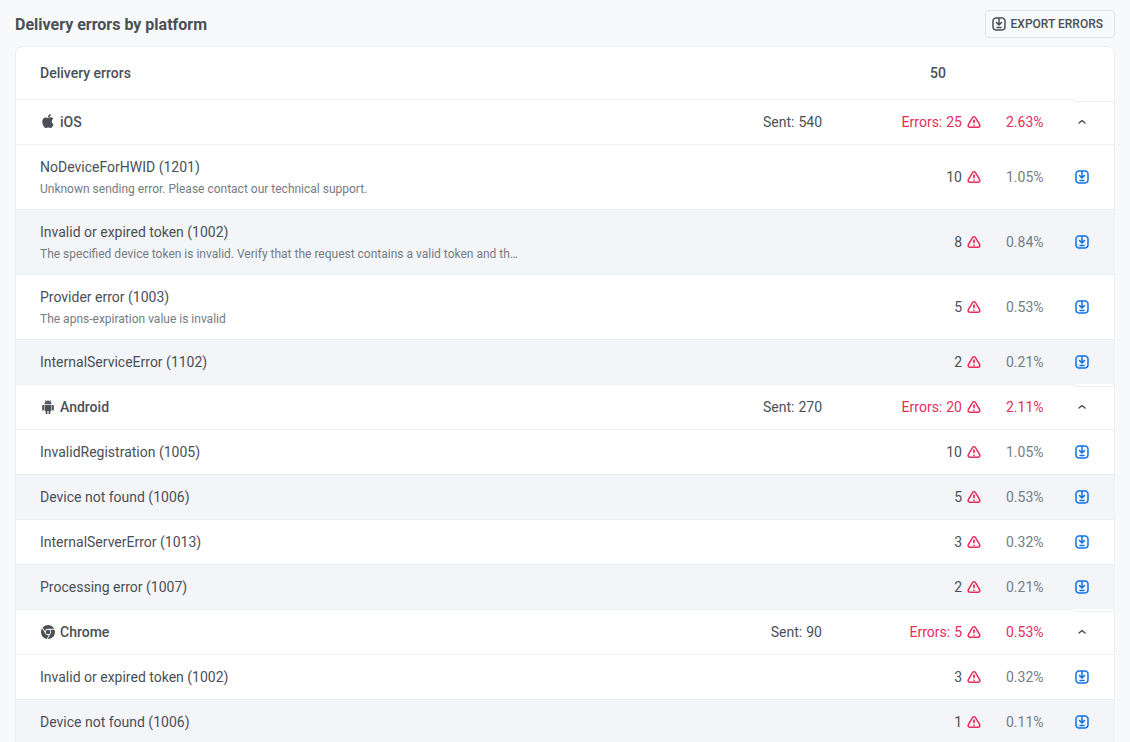
সম্পূর্ণ তালিকা ডাউনলোড করতে Export errors-এ ক্লিক করুন। ত্রুটি এক্সপোর্ট করতে আপনার রোলে Personal data অনুমতি প্রয়োজন।