Общая статистика Journey
Раздел Статистика Journey предоставляет ключевые данные о производительности и аналитику для ваших кампаний Customer Journey. Используйте этот раздел для отслеживания вовлеченности пользователей, достижения целей, доставки сообщений и показателей оттока с течением времени.
Этот раздел включает следующие аналитические дашборды:
-
Производительность: показывает производительность каждой цели, включая количество и коэффициент конверсий.
-
Аудитория: отображает количество пользователей, которые в данный момент находятся в Journey, и тех, кто из него вышел.
-
Коммуникации: предоставляет разбивку отправленных сообщений по каналам (например, Push, Email, SMS, In-app, WhatsApp).
-
Состояние кампании: общая сводка по активности кампании, включая общее количество входов, достигнутых целей и оттоков.
Чтобы просмотреть подробную статистику для любого дашборда, нажмите на название раздела в левой панели.
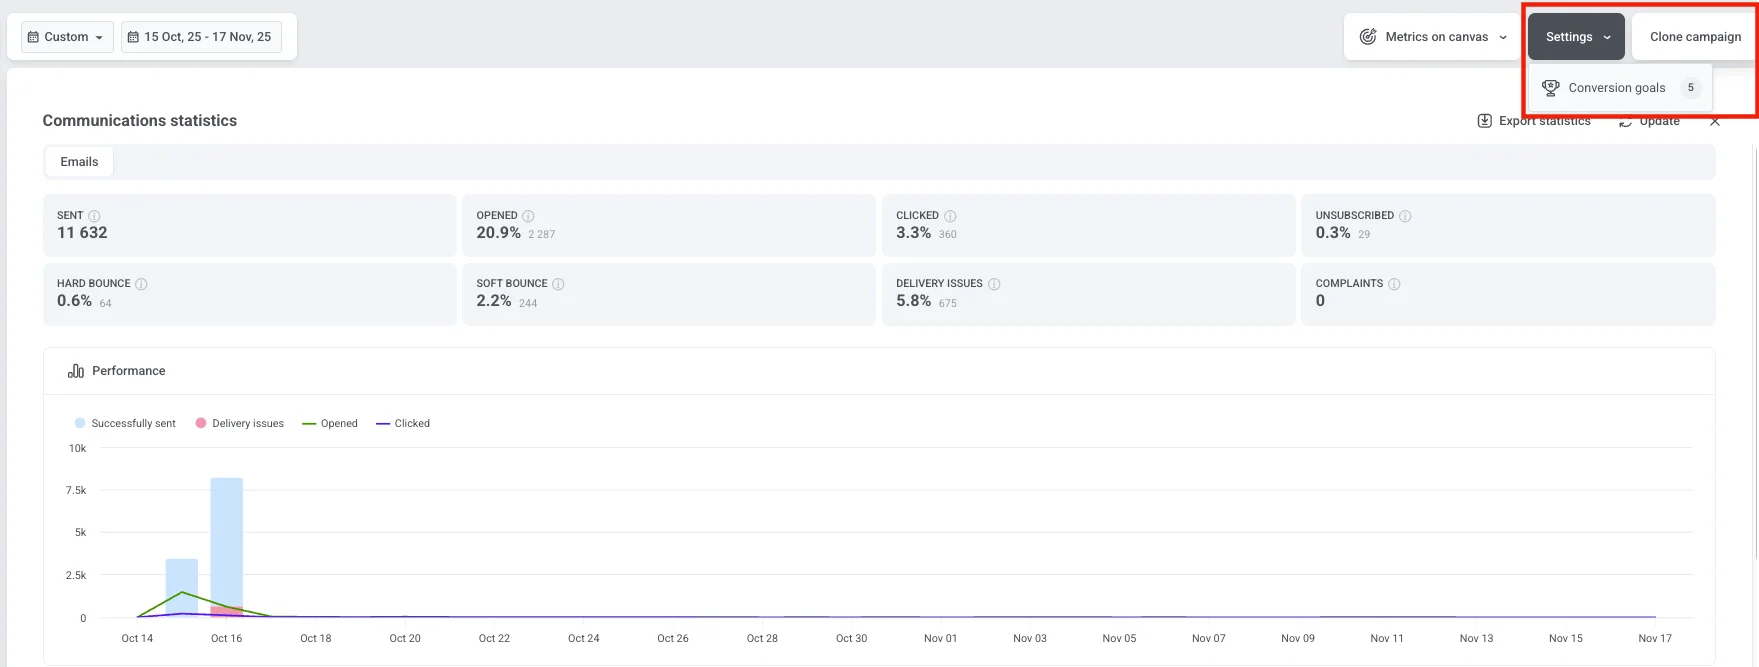
Вы также можете просмотреть количество целей конверсии, настроенных для вашей кампании. Чтобы увидеть подробную информацию о каждой цели, нажмите Настройки и выберите Цели конверсии.
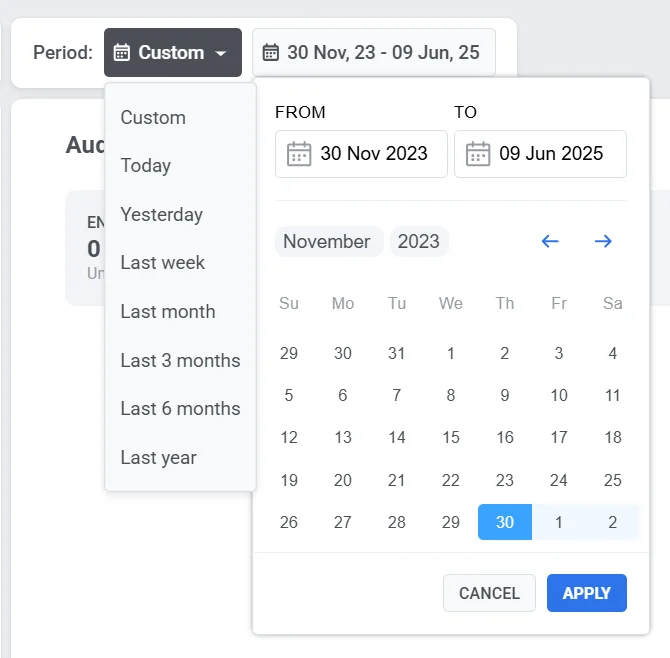
Выбор периода времени
Anchor link toИспользуйте фильтр Период в верхней части дашборда для анализа данных за определенный промежуток времени.
По умолчанию дашборд отображает общую статистику с момента запуска кампании до настоящего времени. Чтобы просмотреть данные за другой период, нажмите на выпадающий список и выберите один из предустановленных вариантов (например, Сегодня, Вчера, 7 дней, 30 дней) или установите пользовательский диапазон дат.
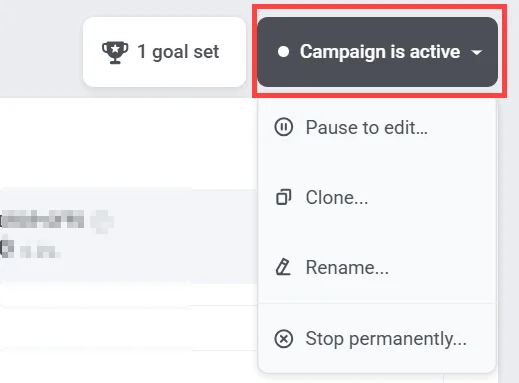
Управление статусом кампании
Anchor link toИспользуйте выпадающий список Статус кампании в правом верхнем углу для управления кампанией. Доступные опции:
-
Приостановить для редактирования
-
Клонировать
-
Переименовать
-
Остановить навсегда. Это действие необратимо.
Производительность
Anchor link toРаздел «Производительность» показывает, насколько эффективно ваша кампания достигает своих целей. Он помогает оценить успешность кампании и определить области для улучшения.
Каждая цель отображается с двумя ключевыми метриками:
-
Коэффициент конверсии (%): процент пользователей, достигших цели, по отношению к общему числу входов в кампанию.
-
Количество: общее число пользователей, достигших цели.
Когда вы нажимаете на название раздела Производительность в левой панели, открывается окно Цели конверсии. В этом представлении содержится подробная информация обо всех целях, настроенных для вашего Journey, включая их метрики производительности и любые определенные условия.
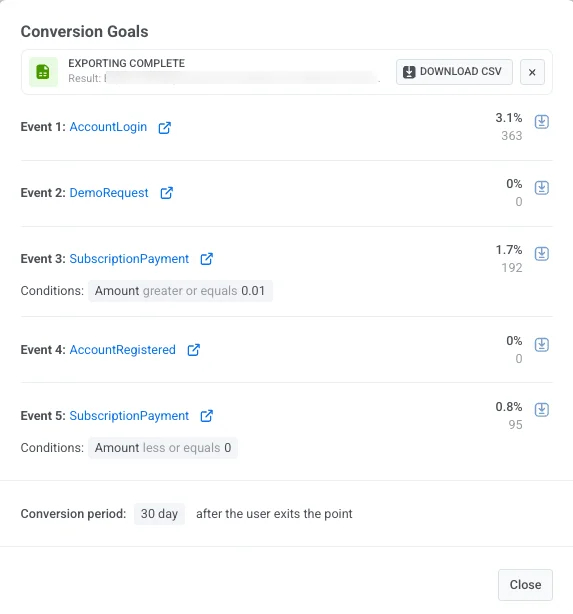
В этом окне вы можете:
- Просматривать данные о конверсиях для каждой цели.
- Просматривать условия цели.
- Видеть период конверсии, который показывает, как долго отслеживаются конверсии после того, как пользователь покинул точку цели (например, 30 дней после выхода).
- Чтобы сохранить статистику по целям, нажмите Скачать CSV рядом с любой целью, чтобы экспортировать ее данные в виде CSV-файла.
Аудитория
Anchor link toДашборд Аудитория предоставляет подробную информацию о том, как пользователи взаимодействуют с вашей кампанией. Он отслеживает активность пользователей на протяжении всего Journey, включая входы, выходы, ошибки и статусы отдельных пользователей.
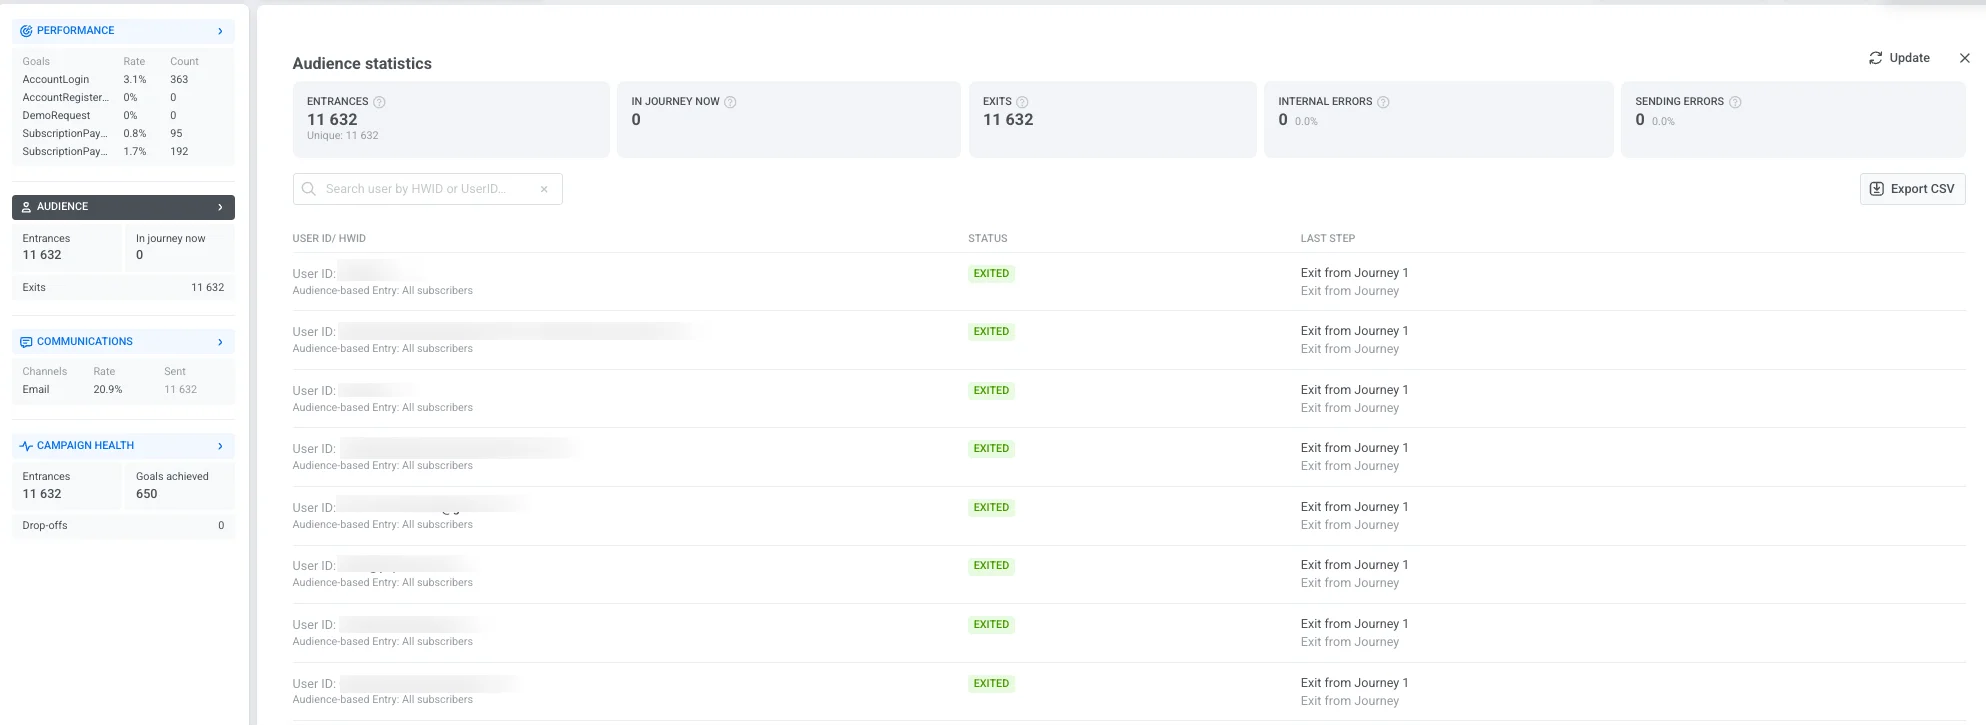
Дашборд включает следующие ключевые метрики:
| Входы | Общее количество пользователей, вошедших в кампанию за выбранный период времени, включая повторные входы. |
| Сейчас в Journey | Количество пользователей, которые в данный момент активны в Journey. |
| Выходы | Количество пользователей, которые завершили или покинули Journey. |
| Внутренние ошибки | Выход пользователей из Journey из-за технических проблем. |
| Ошибки отправки | Сбои доставки, вызванные техническими проблемами, такими как удаленное приложение, недействительный email/телефон или заблокированный шлюз. |
Список пользователей ниже отображает записи по отдельным Journey, помогая вам отслеживать конкретные случаи и устранять проблемы:
| User ID / HWID | Уникальный идентификатор для каждого пользователя. Используйте строку поиска, чтобы найти конкретного пользователя по HWID или User ID. |
| Статус | Указывает текущее состояние пользователя в Journey (например, В процессе, Вышел, Отписался). |
| Последний шаг | Показывает последний завершенный шаг или точку, в которой пользователь покинул Journey. Если пользователь вышел из-за события отмены, в столбце отображается «Выход по событию отмены: [название события]» (например, «Выход по событию отмены: Корзина очищена»). |
Нажмите Экспорт CSV, чтобы загрузить полный список записей пользователей и их статусов для дальнейшего анализа.
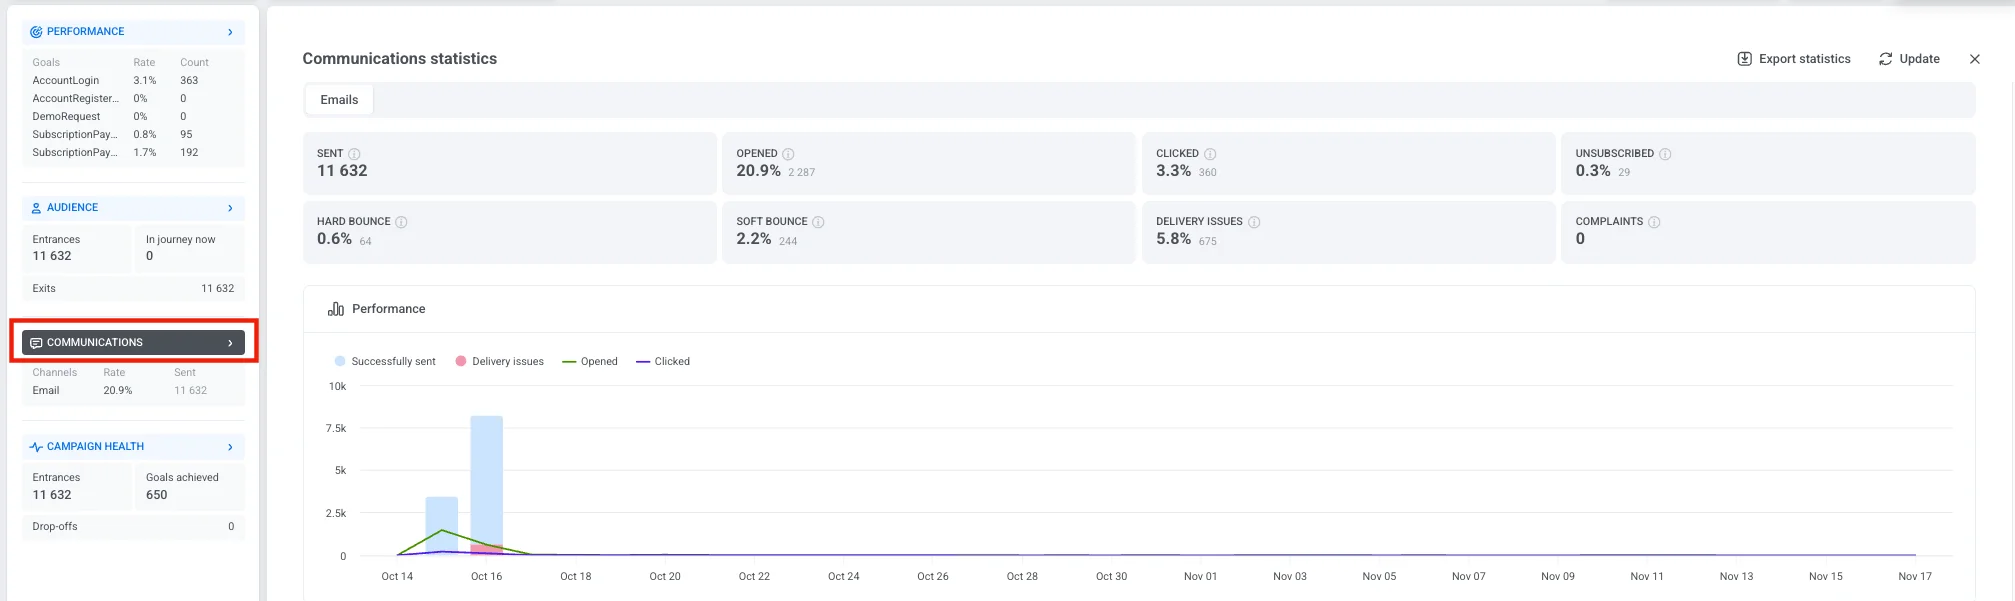
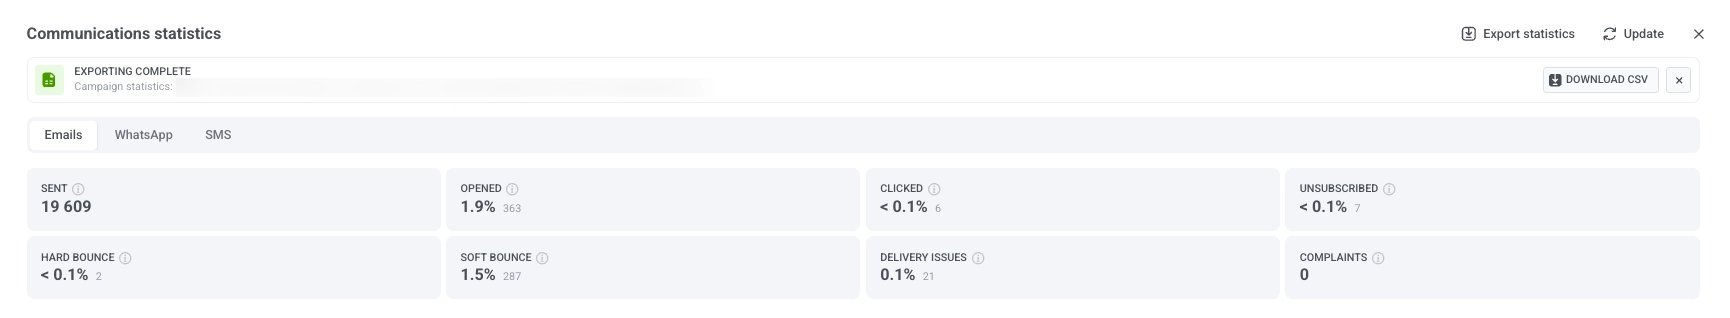
Коммуникации
Anchor link toРаздел Коммуникации предоставляет подробную информацию о производительности каждого канала обмена сообщениями в вашей кампании. Он помогает оценить доставку сообщений, вовлеченность и потенциальные проблемы с доставкой, чтобы вы могли оптимизировать свою коммуникационную стратегию.
Чтобы открыть это представление, нажмите на название раздела Коммуникации в левой панели. Откроется окно Статистика коммуникаций, где вы сможете увидеть, как работают ваши сообщения.
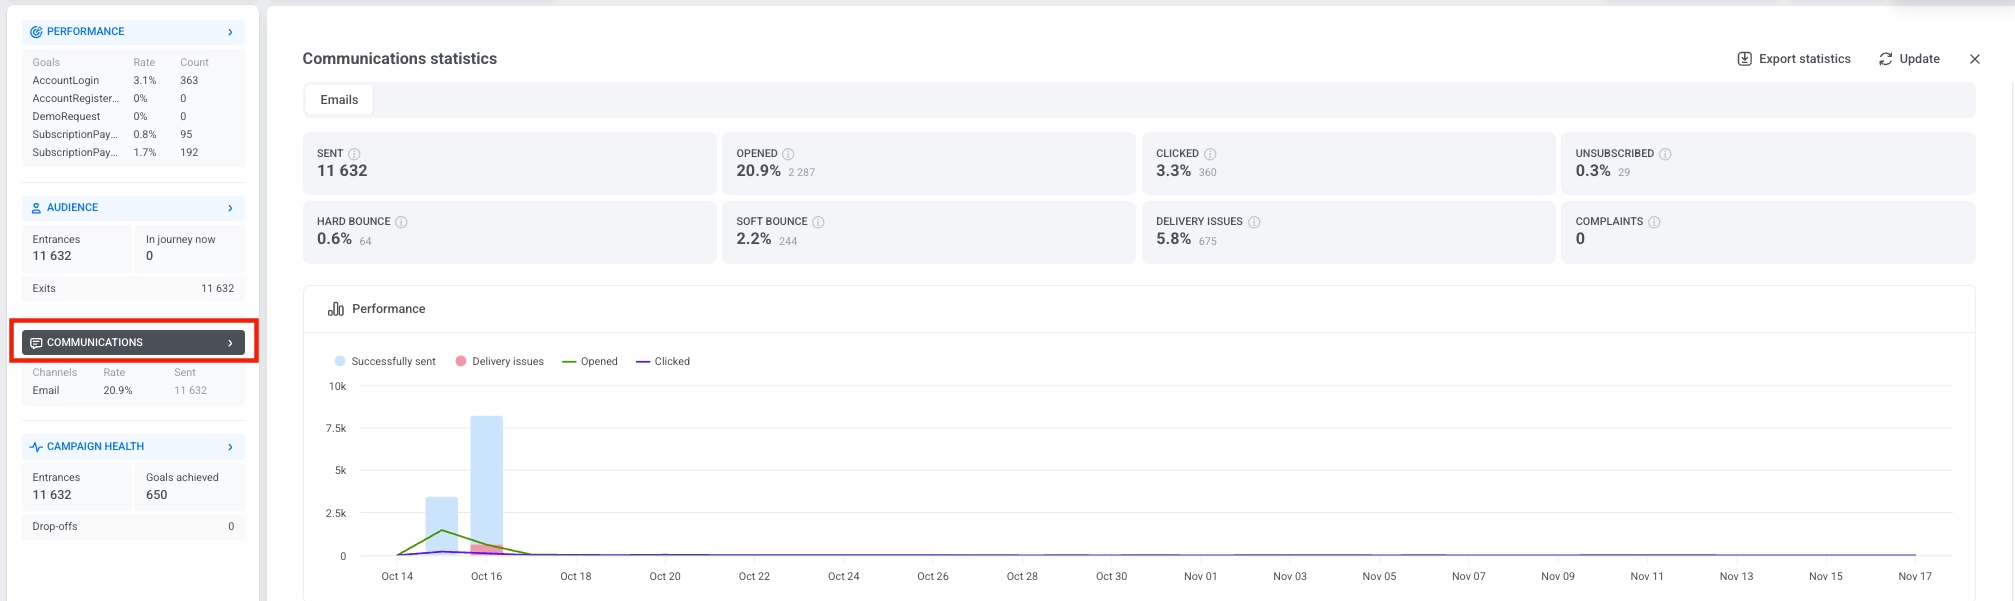
Если ваша кампания включает несколько каналов, в верхней части окна будут показаны отдельные вкладки. Выберите вкладку, чтобы переключаться между каналами и просматривать метрики для каждого из них.
Метрики по каналам
Anchor link toМетрики, отображаемые в окне «Статистика коммуникаций», зависят от канала. Каждый канал отслеживает статистику, наиболее релевантную для данного типа сообщений.
| Метрика | Что измеряет |
|---|---|
| Отправлено | Общее количество отправленных push-уведомлений, включая неудачные попытки отправки. |
| Получатели | Push-уведомления, успешно отправленные Pushwoosh — Отправлено минус неудачные отправки (например, устройства без действительного push-токена). У каждого пользователя может быть несколько устройств, и каждое устройство считается отдельным получателем. |
| Открыто | Количество уникальных открытий сообщений, показанное в процентах от Получателей. Коэффициент открытий = открытия ÷ Получатели × 100% |
| Проблемы с доставкой | Количество сообщений, которые не удалось доставить, показанное в процентах от пользователей, вошедших в любой шаг push-уведомлений в Journey. |
| Метрика | Что измеряет |
|---|---|
| Показы | Количество раз, когда in-app сообщения были показаны пользователям. |
| Взаимодействия | Количество взаимодействий пользователей с in-app сообщениями, показанное в процентах от Показов. Коэффициент взаимодействий = Взаимодействия ÷ Показы × 100% |
| Проблемы с доставкой | Количество сообщений, которые не удалось доставить, показанное в процентах от пользователей, вошедших в любой шаг in-app в Journey. |
| Метрика | Что измеряет |
|---|---|
| Доставлено | Общее количество успешных доставок email, включая повторные доставки одному и тому же получателю. Коэффициент доставки = Доставлено ÷ получатели × 100% |
| Уникальных доставок | Количество уникальных пользователей, которым было успешно доставлено хотя бы одно сообщение, показанное в виде количества и процента от получателей. Коэффициент уникальных доставок = уникальные доставки ÷ получатели × 100% |
| Отправлено | Общее количество отправленных email, включая неудачные попытки отправки. |
| Уникальных открытий | Количество уникальных получателей, открывших сообщение хотя бы один раз, показанное в процентах от получателей. Коэффициент уникальных открытий = уникальные открытия ÷ получатели × 100% |
| Клики | Количество получателей, которые кликнули на любую ссылку в email, показанное в процентах от получателей. Коэффициент кликов = клики по ссылкам ÷ получатели × 100% |
| Отписались | Количество получателей, которые отписались, показанное в процентах от получателей. Коэффициент отписок = отписки ÷ получатели × 100% |
| Hard bounce | Количество email, не доставленных из-за постоянных проблем (например, недействительный адрес), показанное в процентах от получателей. Коэффициент hard bounce = hard bounces ÷ получатели × 100% |
| Soft bounce | Количество email, не доставленных из-за временных проблем (например, переполненный почтовый ящик или ошибка сервера), показанное в процентах от получателей. Коэффициент soft bounce = soft bounces ÷ получатели × 100% |
| Жалобы | Количество получателей, которые пометили email как спам, показанное в процентах от получателей. Коэффициент жалоб = жалобы на спам ÷ получатели × 100% |
| Проблемы с доставкой | Количество сообщений, которые не удалось доставить, показанное в процентах от пользователей, вошедших в любой шаг email в Journey. |
| Метрика | Что измеряет |
|---|---|
| Отправлено | Общее количество отправленных SMS-сообщений, включая неудачные попытки отправки. |
| Доставлено | Количество успешно доставленных сообщений, показанное в процентах от Отправлено. Коэффициент доставки = Доставлено ÷ Отправлено × 100% |
| Проблемы с доставкой | Количество сообщений, которые не удалось доставить, показанное в процентах от пользователей, вошедших в любой шаг SMS в Journey. |
| Метрика | Что измеряет |
|---|---|
| Отправлено | Общее количество отправленных сообщений WhatsApp, включая неудачные попытки отправки. |
| Доставлено | Количество успешно доставленных сообщений, показанное в процентах от получателей — сообщения WhatsApp, успешно отправленные (Отправлено минус неудачные отправки). Коэффициент доставки = Доставлено ÷ получатели × 100% |
| Прочитано | Количество сообщений, прочитанных пользователями, показанное в процентах от получателей. Коэффициент прочтения = Прочитано ÷ получатели × 100% |
| Проблемы с доставкой | Количество сообщений, которые не удалось доставить, показанное в процентах от пользователей, вошедших в любой шаг WhatsApp в Journey. |
Ограничение частоты
Anchor link toНиже метрик канала строка Ограничение частоты показывает, как ограничение частоты повлияло на сообщения этого Journey за выбранный период. Она появляется на вкладках Push, Email, SMS и WhatsApp и отображает две метрики:
- Подавления: количество сообщений, которые не были отправлены, потому что получатель уже достиг своего лимита по ограничению частоты.
- Затронутые пользователи: количество уникальных пользователей, у которых хотя бы одно сообщение было подавлено из-за ограничения частоты.
График Производительность визуализирует активность сообщений с течением времени, помогая выявить тенденции вовлеченности и закономерности доставки.
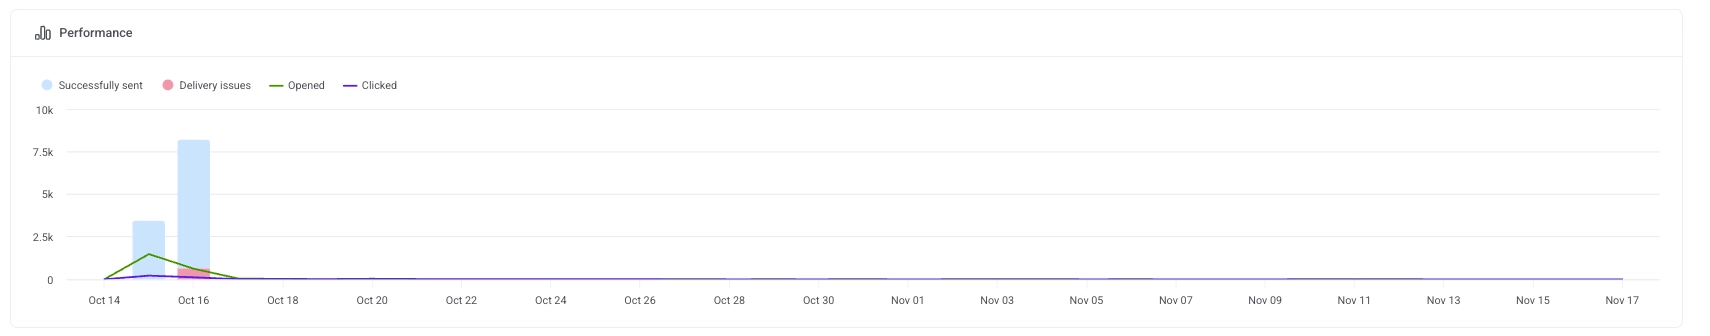
Статистика на уровне сообщений
Anchor link toРаздел Сообщения под графиком «Производительность» перечисляет все шаги коммуникации для выбранного канала. Используйте эту таблицу для сравнения производительности отдельных сообщений в рамках этого канала и для понимания, как каждое сообщение способствует достижению целей вашей кампании.
В верхней части таблицы выберите цель конверсии, чтобы увидеть, как каждое сообщение влияет на эту конкретную цель. Чтобы загрузить все данные на уровне сообщений, нажмите Экспорт статистики канала для экспорта CSV-файла для анализа или отчетности.
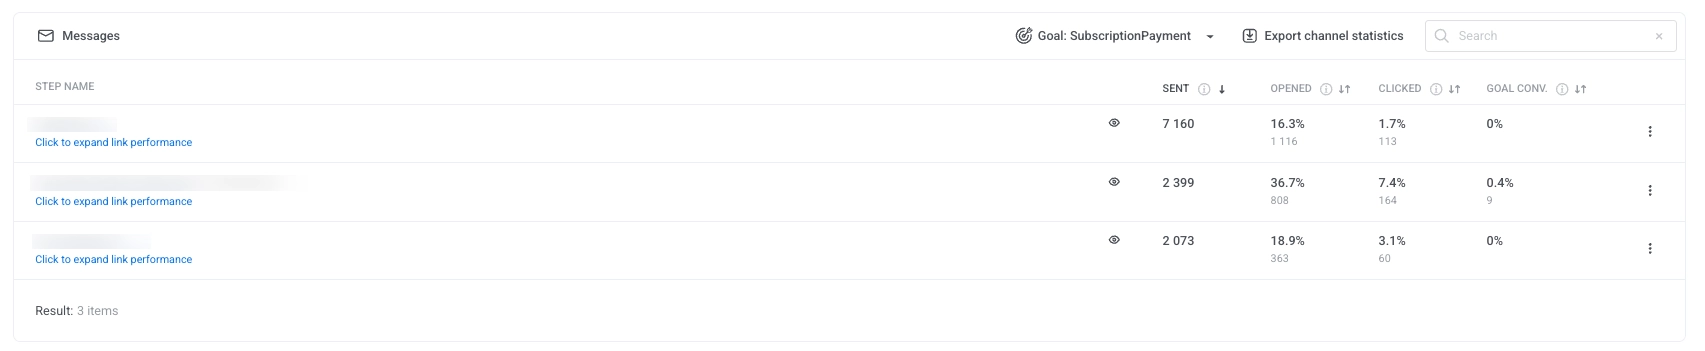
Для каждого сообщения в таблице отображается:
-
Отправлено: Общее количество отправленных сообщений.
-
Открыто: Процент и количество пользователей, открывших сообщение.
-
Клики: Процент и количество пользователей, кликнувших по ссылкам.
-
Конверсия по цели: Процент и количество пользователей, достигших выбранной цели конверсии после взаимодействия с сообщением.
Чтобы экспортировать данные для отдельного сообщения, нажмите на меню из трех точек рядом с названием сообщения и выберите одну из следующих опций:
-
Экспорт статистики точки: Загружает подробные метрики производительности для этого сообщения.
-
Экспорт пользователей точки: Загружает список пользователей, которые взаимодействовали с этим сообщением.
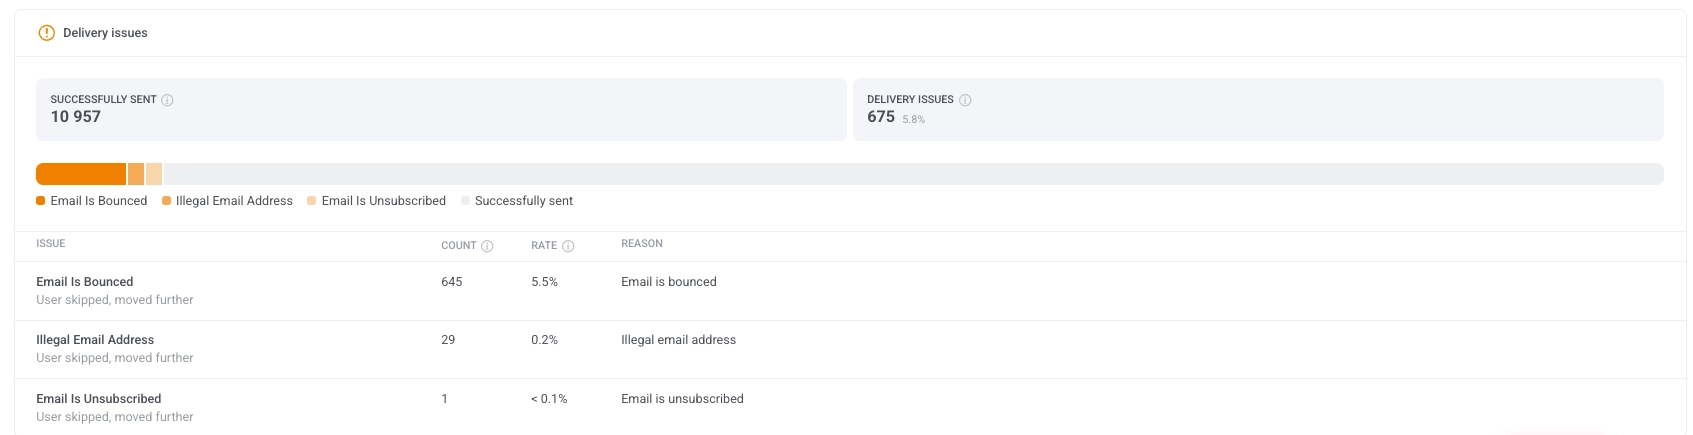
Проблемы с доставкой
Anchor link toРаздел Проблемы с доставкой предоставляет подробную разбивку неудачных или пропущенных доставок сообщений. Он помогает выявлять и устранять распространенные проблемы, которые могут мешать сообщениям доходить до пользователей.
Каждая проблема включает количество, коэффициент и причину, обеспечивая прозрачность надежности доставки.
Состояние кампании
Anchor link toДашборд Состояние кампании предоставляет общую сводку производительности вашей кампании, помогая быстро оценить вовлеченность пользователей, доставку сообщений и достижение целей.
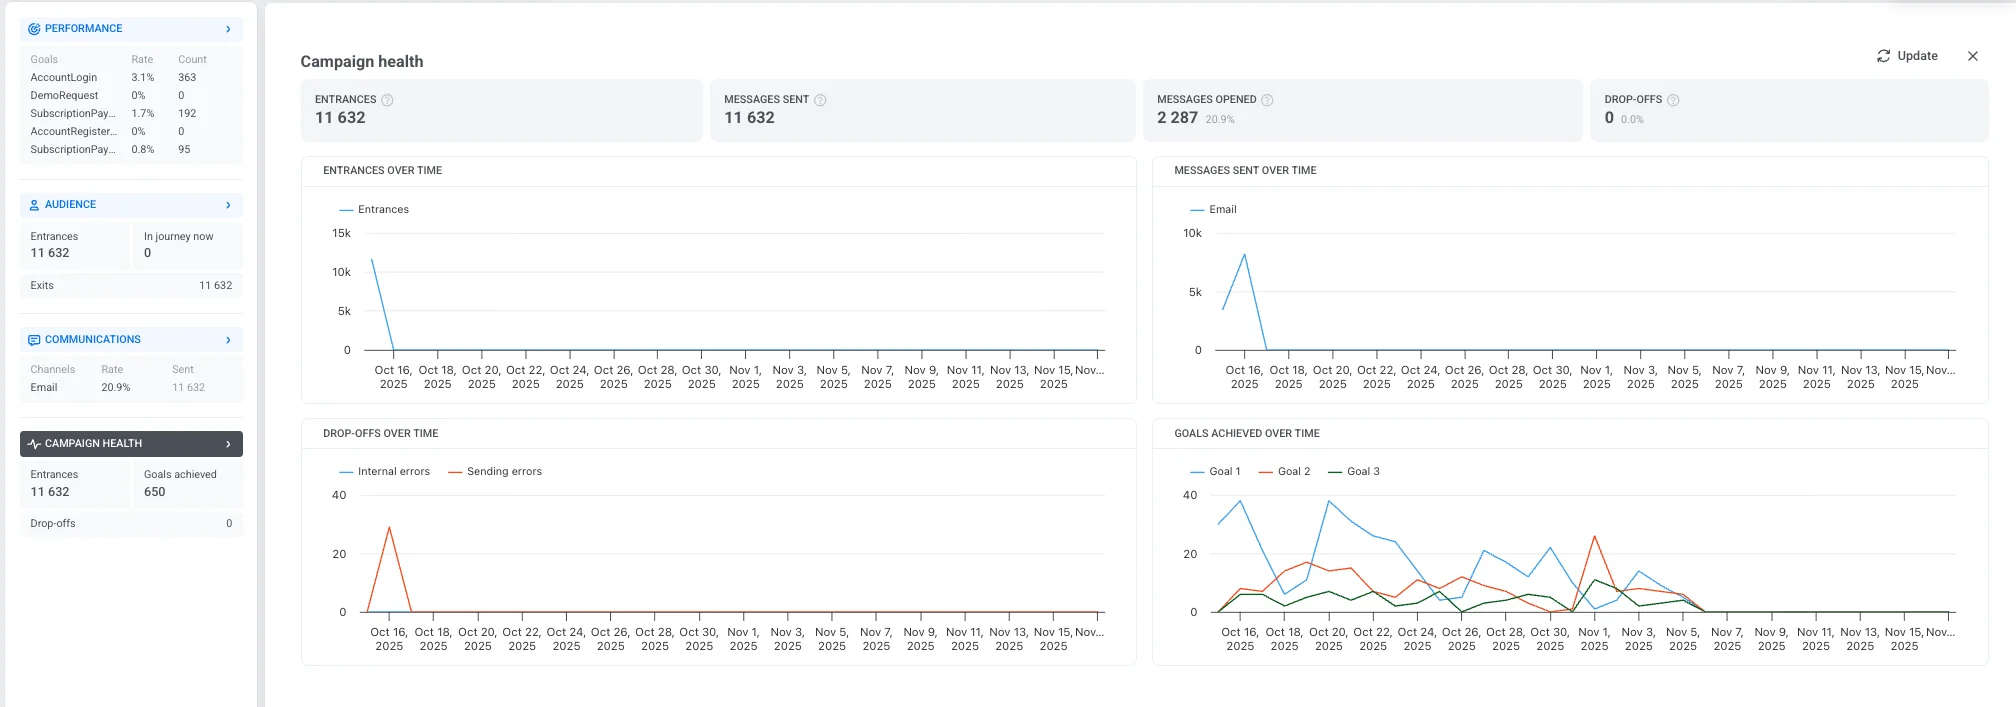
Он включает следующие ключевые метрики:
| Входы | Общее количество пользователей, вошедших в кампанию за выбранный период времени, включая повторные входы. |
| Отправлено сообщений | Общее количество сообщений, отправленных в рамках Journey. |
| Открыто сообщений | Количество и процент сообщений, которые были открыты пользователями. |
| Оттоки | Количество пользователей, удаленных из кампании из-за внутренних проблем. |
Графики ниже помогают визуализировать ключевые тенденции и поведение на протяжении всей кампании:
-
Входы с течением времени Отображает количество пользователей, входящих в кампанию каждый день.
-
Отправленные сообщения с течением времени Показывает ежедневный объем доставки сообщений по разным каналам.
-
Оттоки с течением времени Отслеживает, когда и почему пользователи покинули кампанию, с разбивкой по категориям:
-
Внутренние ошибки: Проблемы, связанные с системной логикой или условиями.
-
Ошибки отправки: Сбои, связанные с доставкой сообщений.
-
-
Достигнутые цели с течением времени Отображает, сколько пользователей достигли целей кампании за выбранный период времени.
Экспорт статистики кампании
Anchor link toPushwoosh позволяет экспортировать полную статистику кампании за выбранный диапазон дат в формате CSV. Это предоставляет подробную информацию о производительности вашей кампании, помогая анализировать ключевые метрики и оптимизировать будущие кампании.
В зависимости от ваших потребностей, вы можете экспортировать данные для одного Journey, нескольких Journey с разными статусами или категориями, или даже для всех Journey сразу.
Чтобы экспортировать статистику кампании:
- Перейдите в Список кампаний.
- Найдите нужную кампанию или используйте фильтры для сужения поиска по статусу, категории или другим критериям. Экспортированный CSV-файл будет отражать эти фильтры. Затем нажмите Экспорт статистики.
Чтобы экспортировать статистику для всех ваших Journey, просто нажмите Экспорт статистики.

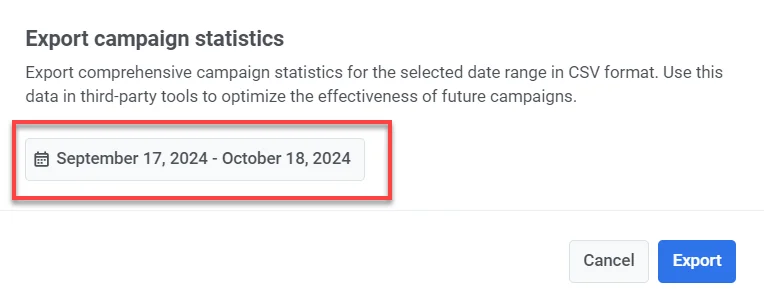
- Выберите диапазон дат, за который вы хотите экспортировать данные, и нажмите Экспорт.
- Как только файл будет готов, нажмите Скачать CSV.
Информация, включенная в экспорт CSV
CSV-файл будет содержать следующую информацию:
- Title: Название кампании или Journey.
- Status: Текущий статус Journey (например, завершено, активно).
- Created: Дата и время создания Journey.
- Category: Категория кампании (например, акция «Черная пятница», акция «Кофе»).
- Type: Тип Journey (например, AudienceBased, TriggerBased).
- UUID: Уникальный идентификатор для Journey.
- Total Reach: Общее количество пользователей, на которых нацелено Journey.
- Unique Users: Количество уникальных пользователей, получивших сообщения в Journey.
- Users Inside: Количество пользователей, все еще активных в Journey.
- Drop-off: Количество пользователей, которые вышли или отписались от Journey.
- Total Sends: Общее количество отправленных сообщений по всем каналам (push, email, SMS и т.д.).
- Avg CTR: Средний коэффициент кликабельности по всем типам сообщений.
- Goals: Количество пользователей, достигших определенных целей в кампании.
- Push Sends: Количество отправленных push-уведомлений в Journey.
- Push CTR: Коэффициент кликабельности для push-уведомлений.
- Email Sends: Количество отправленных email-сообщений в Journey.
- Email CTR: Коэффициент кликабельности для email-сообщений.
- Email Clicks: Общее количество кликов по ссылкам в email.
- Email Unsubscribes: Количество пользователей, отписавшихся от вашей email-рассылки.
- SMS Sends: Количество отправленных SMS-сообщений в Journey.
- SMS Deliveries: Количество успешно доставленных SMS-сообщений.
- WhatsApp Sends: Количество отправленных сообщений WhatsApp в Journey.
- WhatsApp Opens: Количество сообщений WhatsApp, открытых пользователями.
- In-App Shows: Количество in-app сообщений, показанных пользователям.
- In-App Interaction: Количество пользователей, которые взаимодействовали с in-app сообщениями (например, нажали кнопку).
- In-App Skips: Количество пользователей, которые пропустили или закрыли in-app сообщение без взаимодействия.