Estadísticas generales del Journey
La sección Estadísticas del Journey proporciona datos clave de rendimiento e información para sus campañas de Customer Journey. Utilice esta sección para realizar un seguimiento de la participación del usuario, la finalización de objetivos, la entrega de mensajes y las tasas de abandono a lo largo del tiempo.
Esta sección incluye los siguientes paneles de análisis:
-
Rendimiento: Muestra el rendimiento de cada objetivo, incluyendo los recuentos y las tasas de conversión.
-
Audiencia: Muestra el número de usuarios que se encuentran actualmente en el journey y los que han salido.
-
Comunicaciones: Desglosa los mensajes enviados por canal (por ejemplo, Push, Email, SMS, In-app, WhatsApp).
-
Estado de la campaña: Un resumen de alto nivel de la actividad de la campaña, incluyendo las entradas totales, los objetivos alcanzados y los abandonos.
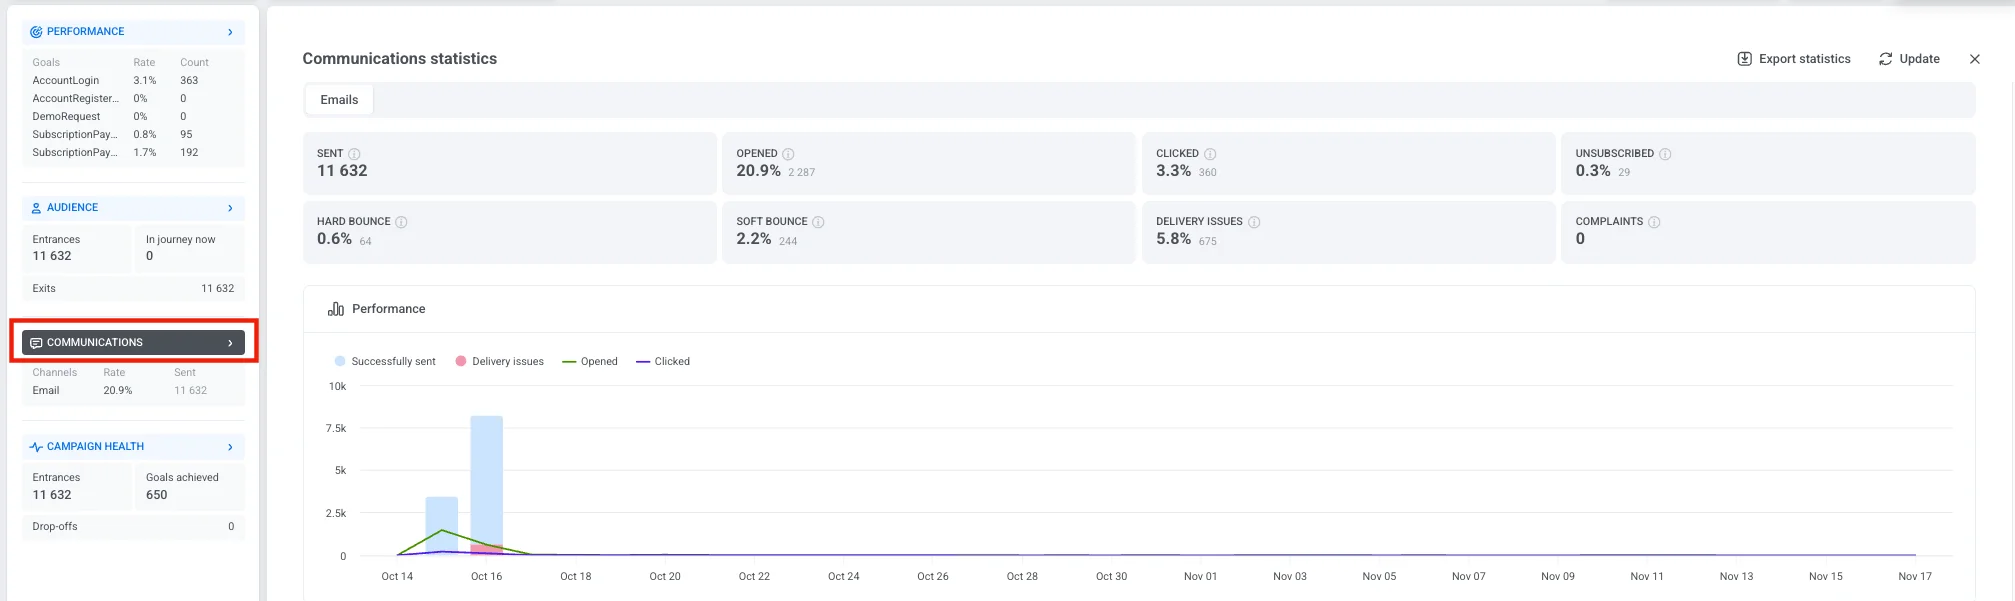
Para ver estadísticas detalladas de cualquier panel, haga clic en el nombre de una sección en el panel izquierdo.
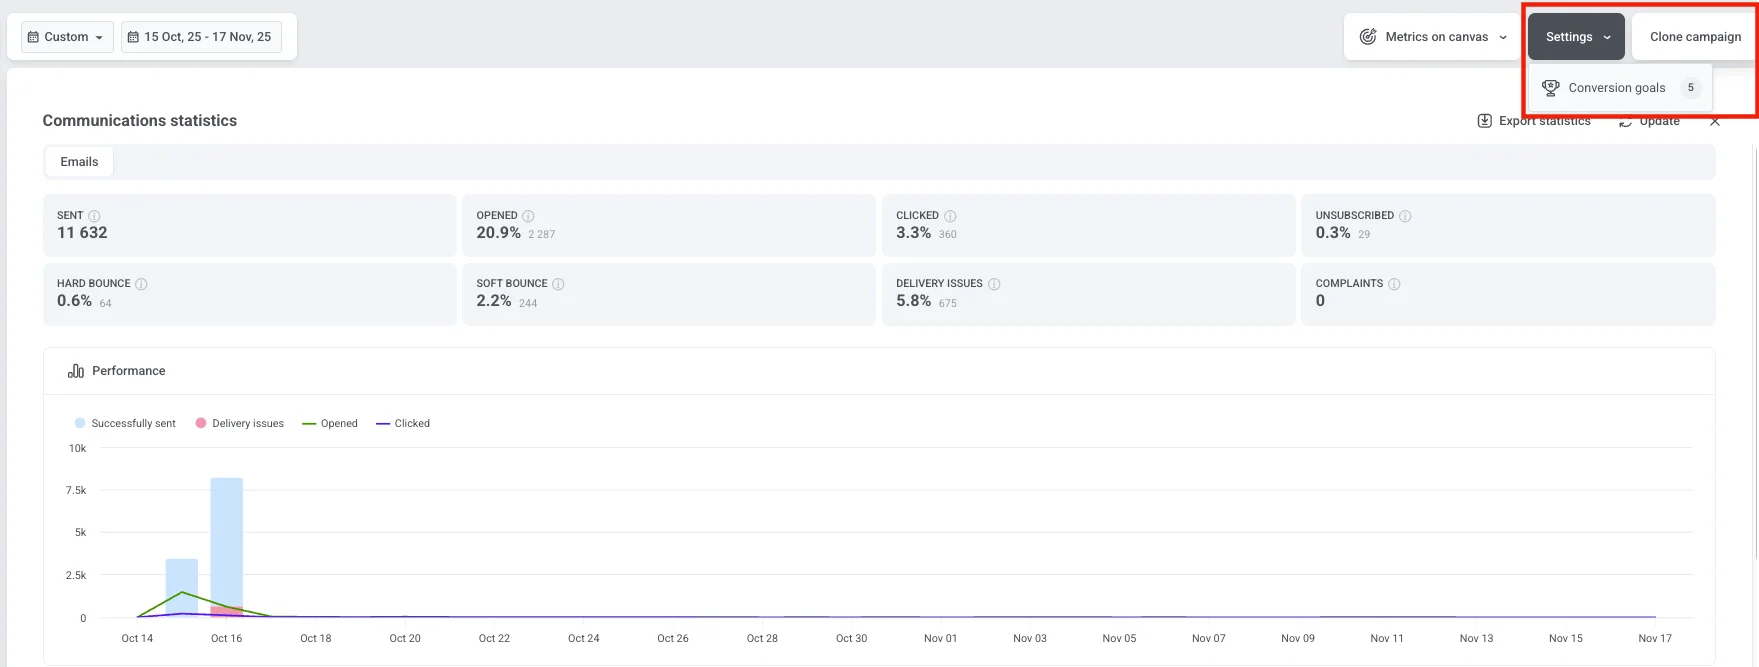
También puede ver el número de objetivos de conversión configurados para su campaña. Para ver información detallada sobre cada objetivo, haga clic en Configuración y seleccione Objetivos de conversión.
Seleccionar un período de tiempo
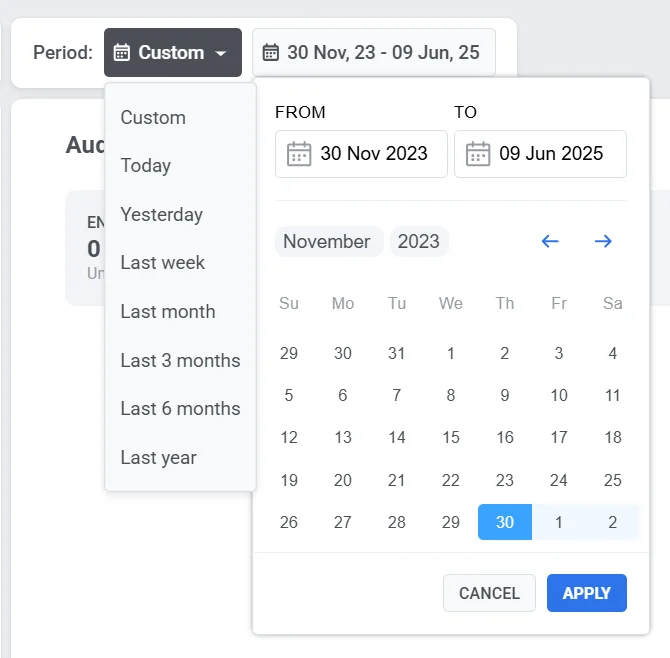
Anchor link toUtilice el filtro Período en la parte superior del panel para analizar los datos de un rango de tiempo específico.
Por defecto, el panel muestra las estadísticas generales desde el lanzamiento de la campaña hasta el presente. Para ver los datos de un período de tiempo diferente, haga clic en el menú desplegable y elija entre las opciones predefinidas (por ejemplo, Hoy, Ayer, 7 días, 30 días), o establezca un rango de fechas personalizado.
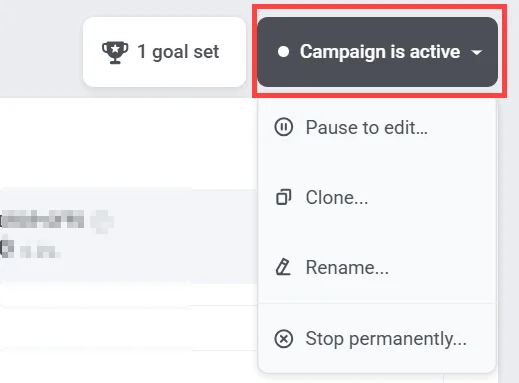
Gestionar el estado de la campaña
Anchor link toUtilice el menú desplegable Estado de la campaña en la esquina superior derecha para gestionar la campaña. Las opciones disponibles incluyen:
-
Pausar para editar
-
Clonar
-
Renombrar
-
Detener permanentemente. Esta acción es irreversible.
Rendimiento
Anchor link toLa sección de Rendimiento muestra cuán eficazmente su campaña alcanza sus objetivos. Le ayuda a evaluar el éxito de la campaña e identificar áreas de mejora.
Cada objetivo se muestra con dos métricas clave:
-
Tasa de conversión (%): El porcentaje de usuarios que alcanzaron el objetivo en relación con el total de entradas a la campaña.
-
Recuento: El número total de usuarios que completaron el objetivo.
Cuando hace clic en el nombre de la sección Rendimiento en el panel izquierdo, se abre la ventana Objetivos de Conversión. Esta vista proporciona información detallada sobre todos los objetivos configurados para su journey, incluyendo sus métricas de rendimiento y cualquier condición definida.
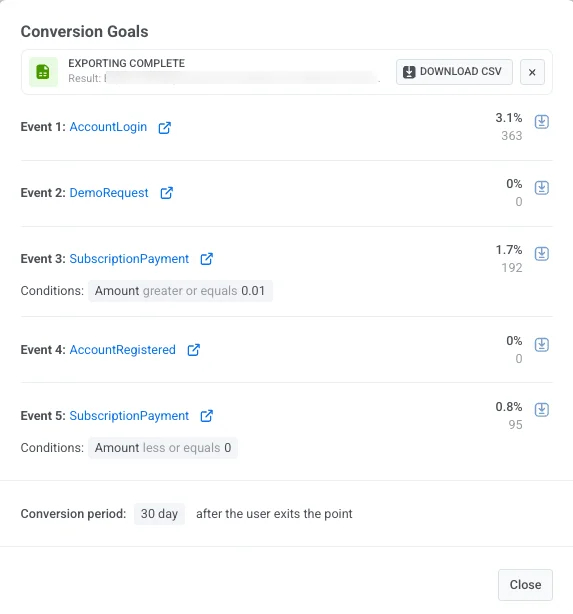
En esta ventana, puede:
- Revisar los datos de conversión para cada objetivo.
- Ver las condiciones del objetivo.
- Ver el período de conversión, que muestra durante cuánto tiempo se rastrean las conversiones después de que un usuario sale del punto del objetivo (por ejemplo, 30 días después de la salida).
- Para guardar las estadísticas de los objetivos, haga clic en Descargar CSV junto a cualquier objetivo para exportar sus datos como un archivo CSV.
Audiencia
Anchor link toEl panel de Audiencia proporciona información detallada sobre cómo los usuarios interactúan con su campaña. Rastrea la actividad del usuario a lo largo del journey, incluyendo entradas, salidas, errores y estados de usuarios individuales.
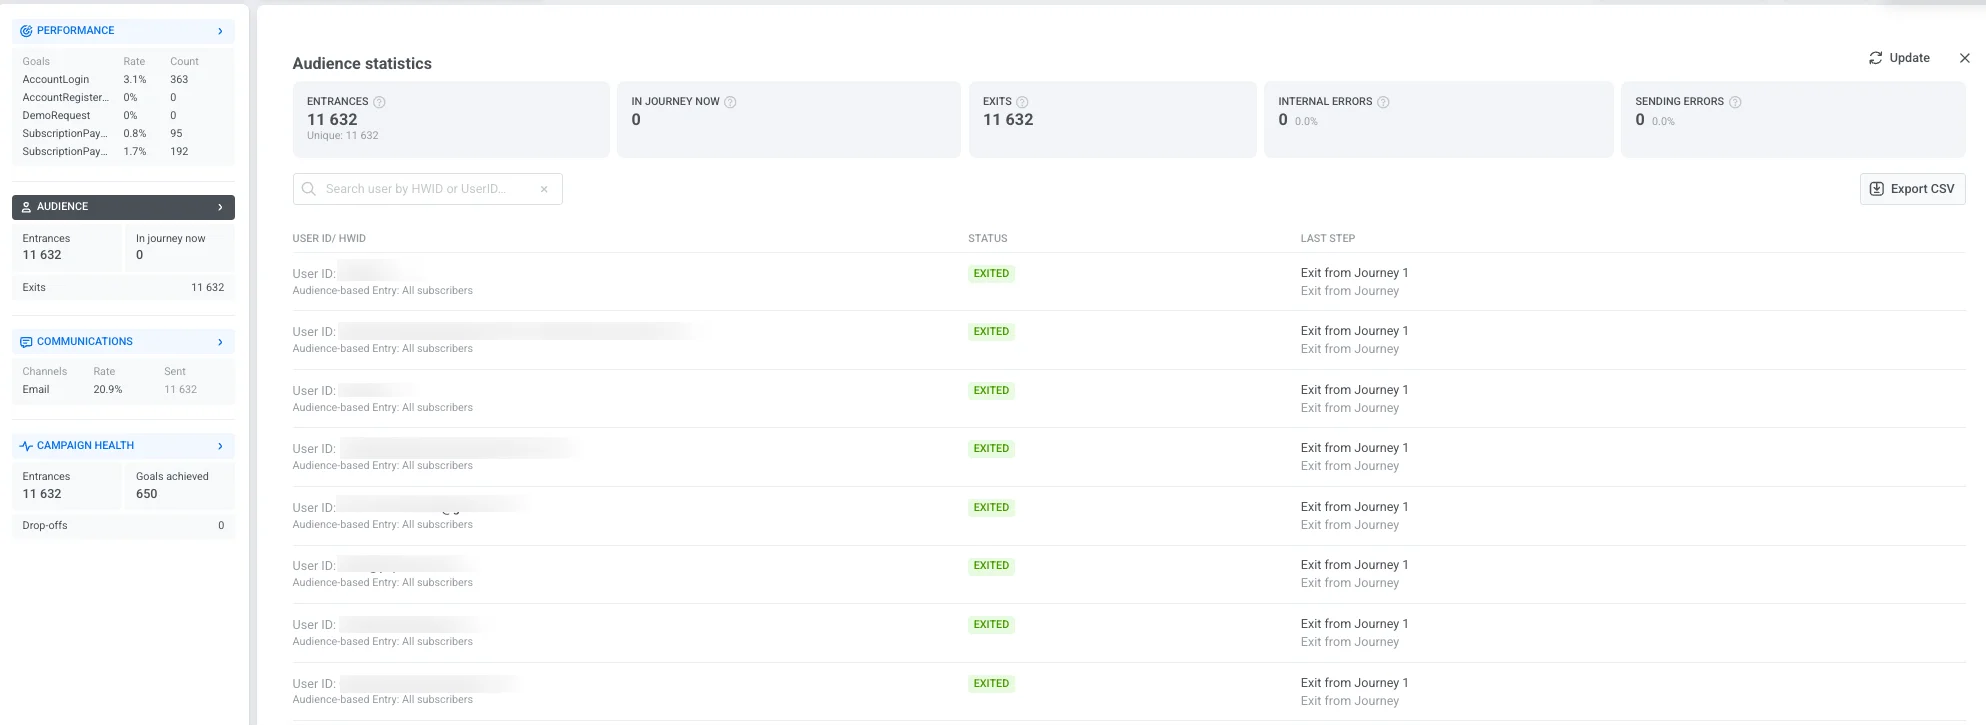
El panel incluye las siguientes métricas clave:
| Entradas | Número total de usuarios que entraron en la campaña durante el período de tiempo seleccionado, incluyendo entradas repetidas. |
| En el journey ahora | Número de usuarios actualmente activos en el journey. |
| Salidas | Número de usuarios que han completado o salido del journey. |
| Errores internos | Abandonos de usuarios del journey causados por problemas técnicos. |
| Errores de envío | Fallos de entrega causados por problemas técnicos como una aplicación desinstalada, un correo electrónico/teléfono no válido o una puerta de enlace bloqueada. |
La lista de usuarios a continuación muestra registros individuales del journey, ayudándole a monitorear casos específicos y solucionar problemas:
| ID de Usuario / HWID | Un identificador único para cada usuario. Utilice la barra de búsqueda para encontrar un usuario específico por HWID o ID de Usuario. |
| Estado | Indica el estado actual del usuario en el journey (por ejemplo, En curso, Salió, Abandonó). |
| Último paso | Muestra el último paso completado o el punto en el que el usuario salió del journey. Si un usuario salió debido a un evento de cancelación, la columna muestra “Salida por evento de cancelación: [nombre del evento]” (por ejemplo, “Salida por evento de cancelación: Carrito limpiado”). |
Haga clic en Exportar CSV para descargar la lista completa de registros de usuarios y sus estados para un análisis más detallado.
Comunicaciones
Anchor link toLa sección de Comunicaciones proporciona información detallada sobre el rendimiento de cada canal de mensajería en su campaña. Le ayuda a evaluar la entrega de mensajes, la participación y los posibles problemas de entrega para que pueda optimizar su estrategia de comunicación.
Para abrir esta vista, haga clic en el nombre de la sección Comunicaciones en el panel izquierdo. Esto abre la ventana de Estadísticas de comunicaciones donde puede ver el rendimiento de sus mensajes.
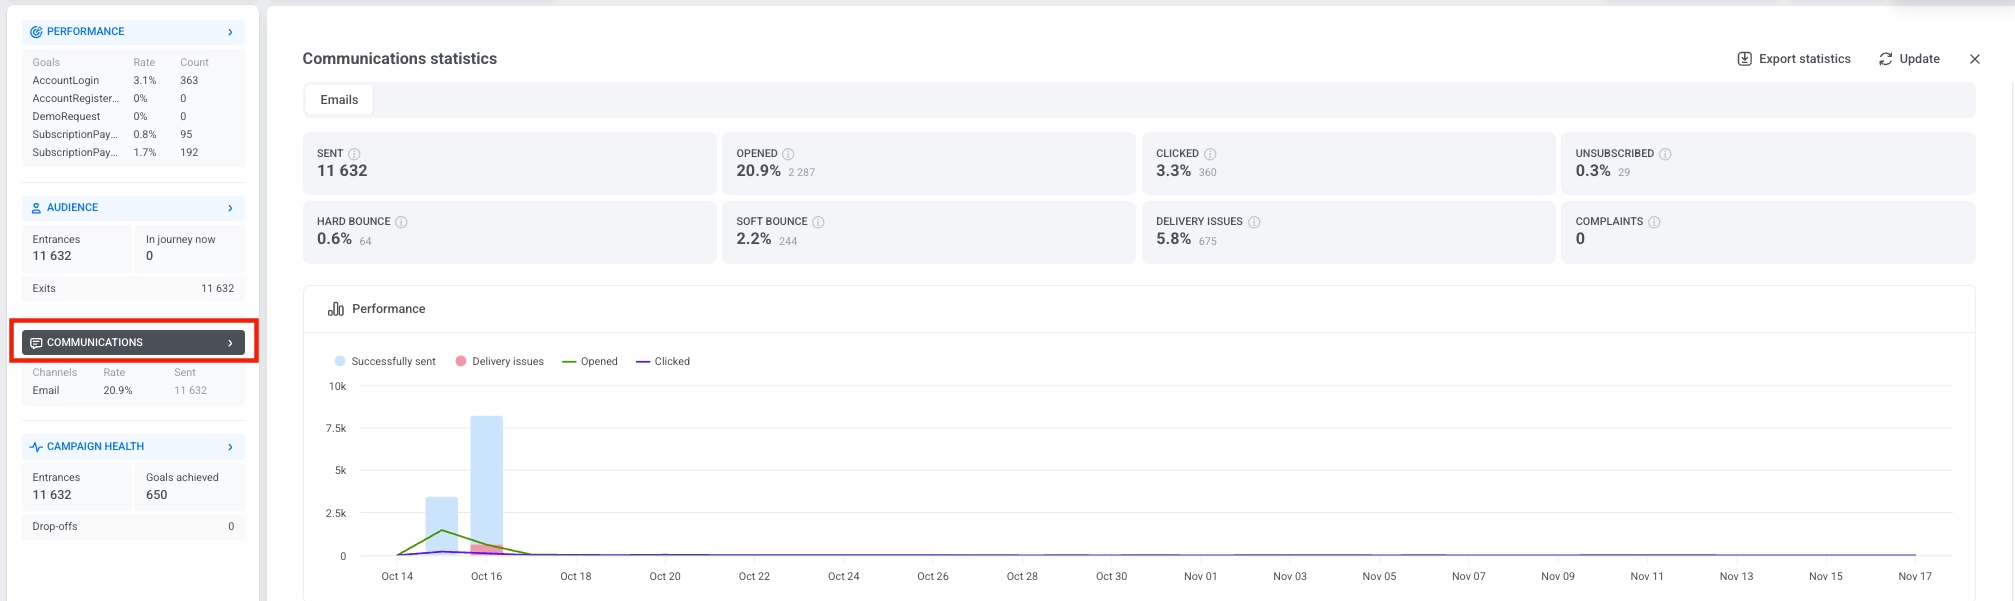
Si su campaña incluye múltiples canales, se mostrarán pestañas separadas en la parte superior de la ventana. Seleccione una pestaña para cambiar entre canales y revisar las métricas de cada uno.
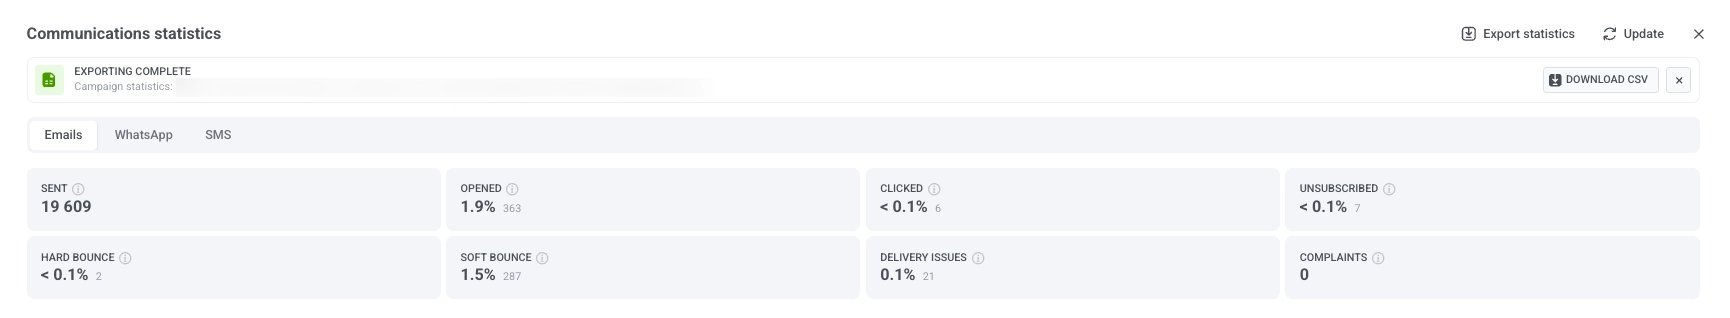
Métricas por canal
Anchor link toLas métricas que se muestran en la ventana de estadísticas de Comunicaciones dependen del canal. Cada canal rastrea las estadísticas que son más relevantes para ese tipo de mensaje.
| Métrica | Qué mide |
|---|---|
| Enviados | Número total de notificaciones push enviadas, incluyendo intentos de envío fallidos. |
| Destinatarios | Notificaciones push que Pushwoosh envió con éxito — Enviados menos envíos fallidos (por ejemplo, dispositivos sin un token push válido). Cada usuario puede tener múltiples dispositivos, y cada dispositivo cuenta como un destinatario separado. |
| Abiertos | Número de aperturas de mensajes únicos, mostrado como un porcentaje de los Destinatarios. Tasa de apertura = aperturas ÷ Destinatarios × 100% |
| Problemas de entrega | Número de mensajes que no pudieron ser entregados, mostrado como un porcentaje de los usuarios que entraron en cualquier paso de push en el journey. |
| Métrica | Qué mide |
|---|---|
| Impresiones | Número de veces que los mensajes in-app se mostraron a los usuarios. |
| Interacciones | Número de interacciones de los usuarios con los mensajes in-app, mostrado como un porcentaje de las Impresiones. Tasa de interacción = Interacciones ÷ Impresiones × 100% |
| Problemas de entrega | Número de mensajes que no pudieron ser entregados, mostrado como un porcentaje de los usuarios que entraron en cualquier paso de in-app en el journey. |
| Métrica | Qué mide |
|---|---|
| Entregados | Número total de entregas de correo electrónico exitosas, incluyendo entregas repetidas al mismo destinatario. Tasa de entrega = Entregados ÷ destinatarios × 100% |
| Entregados únicos | Número de usuarios únicos que tuvieron al menos un mensaje entregado con éxito, mostrado como un recuento y como un porcentaje de los destinatarios. Tasa de entrega única = entregas únicas ÷ destinatarios × 100% |
| Enviados | Número total de correos electrónicos enviados, incluyendo intentos de envío fallidos. |
| Abiertos únicos | Número de destinatarios únicos que abrieron el mensaje al menos una vez, mostrado como un porcentaje de los destinatarios. Tasa de apertura única = aperturas únicas ÷ destinatarios × 100% |
| Clics | Número de destinatarios que hicieron clic en cualquier enlace del correo electrónico, mostrado como un porcentaje de los destinatarios. Tasa de clics = clics en enlaces ÷ destinatarios × 100% |
| Desuscritos | Número de destinatarios que se desuscribieron, mostrado como un porcentaje de los destinatarios. Tasa de desuscripción = desuscripciones ÷ destinatarios × 100% |
| Rebote duro | Número de correos electrónicos no entregados debido a problemas permanentes (por ejemplo, dirección no válida), mostrado como un porcentaje de los destinatarios. Tasa de rebote duro = rebotes duros ÷ destinatarios × 100% |
| Rebote suave | Número de correos electrónicos no entregados debido a problemas temporales (por ejemplo, bandeja de entrada llena o error del servidor), mostrado como un porcentaje de los destinatarios. Tasa de rebote suave = rebotes suaves ÷ destinatarios × 100% |
| Quejas | Número de destinatarios que marcaron el correo electrónico como spam, mostrado como un porcentaje de los destinatarios. Tasa de quejas = informes de spam ÷ destinatarios × 100% |
| Problemas de entrega | Número de mensajes que no pudieron ser entregados, mostrado como un porcentaje de los usuarios que entraron en cualquier paso de correo electrónico en el journey. |
| Métrica | Qué mide |
|---|---|
| Enviados | Número total de mensajes SMS enviados, incluyendo intentos de envío fallidos. |
| Entregados | Número de mensajes entregados con éxito, mostrado como un porcentaje de los Enviados. Tasa de entrega = Entregados ÷ Enviados × 100% |
| Problemas de entrega | Número de mensajes que no pudieron ser entregados, mostrado como un porcentaje de los usuarios que entraron en cualquier paso de SMS en el journey. |
| Métrica | Qué mide |
|---|---|
| Enviados | Número total de mensajes de WhatsApp enviados, incluyendo intentos de envío fallidos. |
| Entregados | Número de mensajes entregados con éxito, mostrado como un porcentaje de los destinatarios — mensajes de WhatsApp enviados con éxito (Enviados menos envíos fallidos). Tasa de entrega = Entregados ÷ destinatarios × 100% |
| Leídos | Número de mensajes leídos por los usuarios, mostrado como un porcentaje de los destinatarios. Tasa de lectura = Leídos ÷ destinatarios × 100% |
| Problemas de entrega | Número de mensajes que no pudieron ser entregados, mostrado como un porcentaje de los usuarios que entraron en cualquier paso de WhatsApp en el journey. |
Frequency capping
Anchor link toDebajo de las métricas del canal, la fila de Frequency capping muestra cómo el frequency capping afectó los mensajes de este journey durante el período seleccionado. Aparece en las pestañas de Push, Email, SMS y WhatsApp y muestra dos métricas:
- Supresiones: el número de mensajes que no se enviaron porque el destinatario ya había alcanzado su límite de frequency capping.
- Usuarios afectados: el número de usuarios únicos a los que se les suprimió al menos un mensaje por frequency capping.
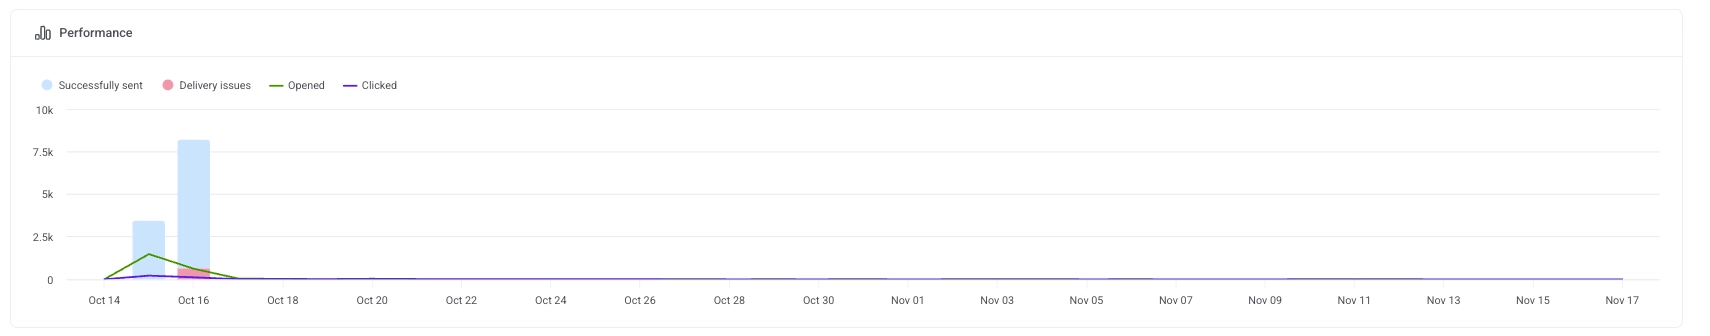
El gráfico de Rendimiento visualiza la actividad de los mensajes a lo largo del tiempo, ayudándole a identificar tendencias de participación y patrones de entrega.
Estadísticas a nivel de mensaje
Anchor link toLa sección Mensajes debajo del gráfico de Rendimiento lista todos los pasos de comunicación para el canal de comunicación seleccionado. Utilice esta tabla para comparar el rendimiento de los mensajes individuales dentro de este canal y para entender cómo cada mensaje contribuye a los objetivos de su campaña.
En la parte superior de la tabla, seleccione un objetivo de conversión para ver cómo cada mensaje influye en ese objetivo específico. Para descargar todos los datos a nivel de mensaje, haga clic en Exportar estadísticas del canal para exportar un archivo CSV para análisis o informes.
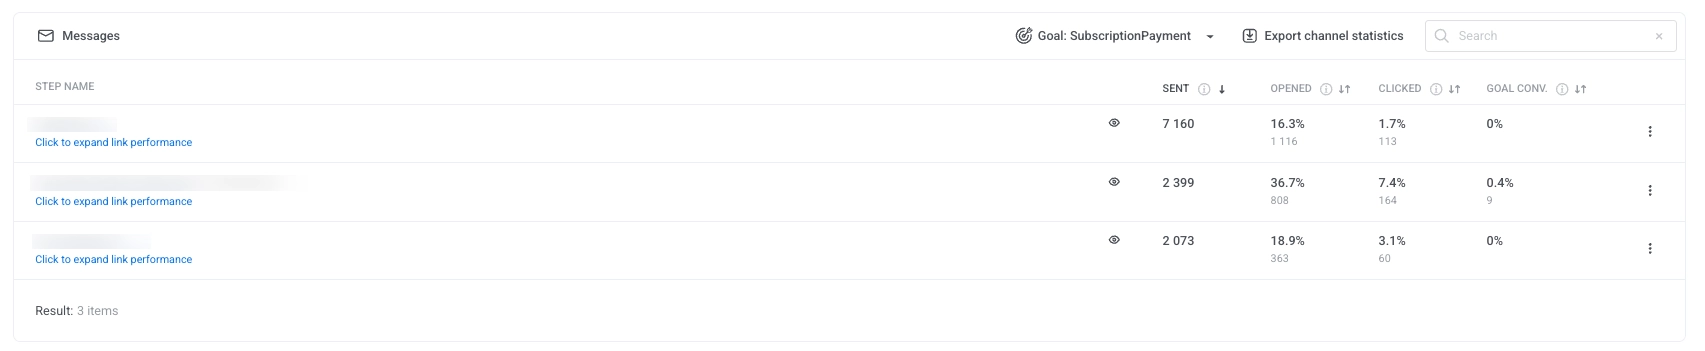
Para cada mensaje, la tabla muestra:
-
Enviados: El número total de mensajes enviados.
-
Abiertos: El porcentaje y el número de usuarios que abrieron el mensaje.
-
Clics: El porcentaje y el número de usuarios que hicieron clic en los enlaces.
-
Conversión del objetivo: El porcentaje y el número de usuarios que completaron el objetivo de conversión seleccionado después de interactuar con el mensaje.
Para exportar datos de un mensaje individual, haga clic en el menú de tres puntos junto al nombre del mensaje y elija una de las siguientes opciones:
-
Exportar estadísticas del punto: Descarga métricas de rendimiento detalladas para ese mensaje.
-
Exportar usuarios del punto: Descarga una lista de usuarios que interactuaron con ese mensaje.
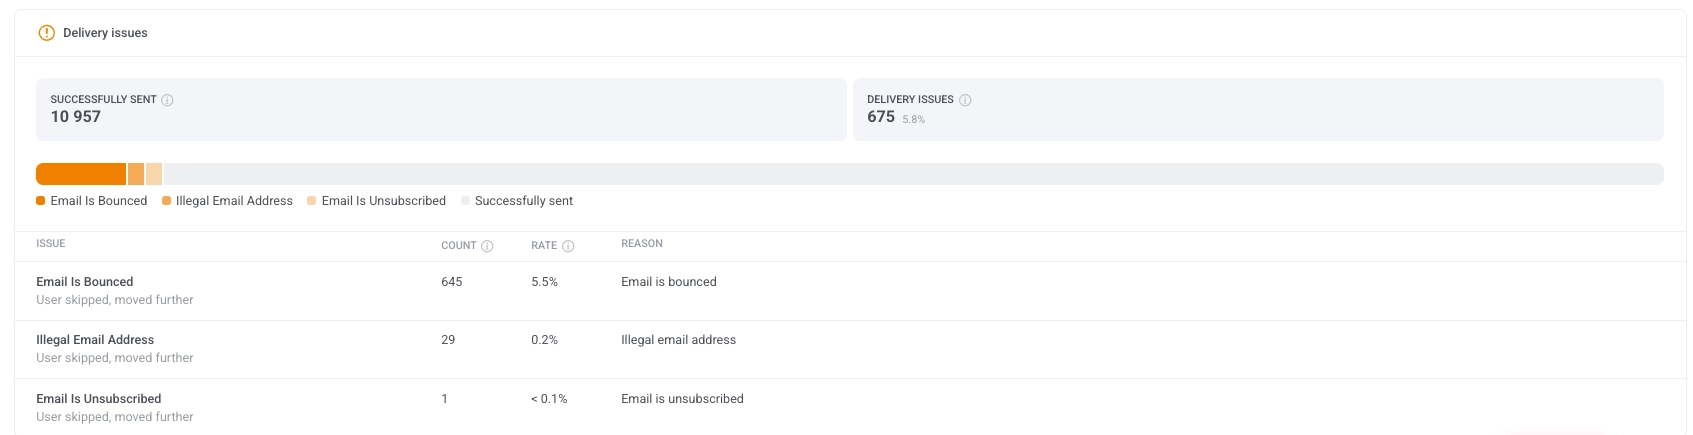
Problemas de entrega
Anchor link toLa sección Problemas de entrega proporciona un desglose detallado de las entregas de mensajes fallidas u omitidas. Le ayuda a identificar y abordar problemas comunes que pueden impedir que los mensajes lleguen a los usuarios.
Cada problema incluye un recuento, una tasa y una razón, lo que le da transparencia sobre la fiabilidad de la entrega.
Estado de la campaña
Anchor link toEl panel de Estado de la campaña proporciona un resumen de alto nivel del rendimiento de su campaña, ayudándole a evaluar rápidamente la participación del usuario, la entrega de mensajes y la progresión de los objetivos.
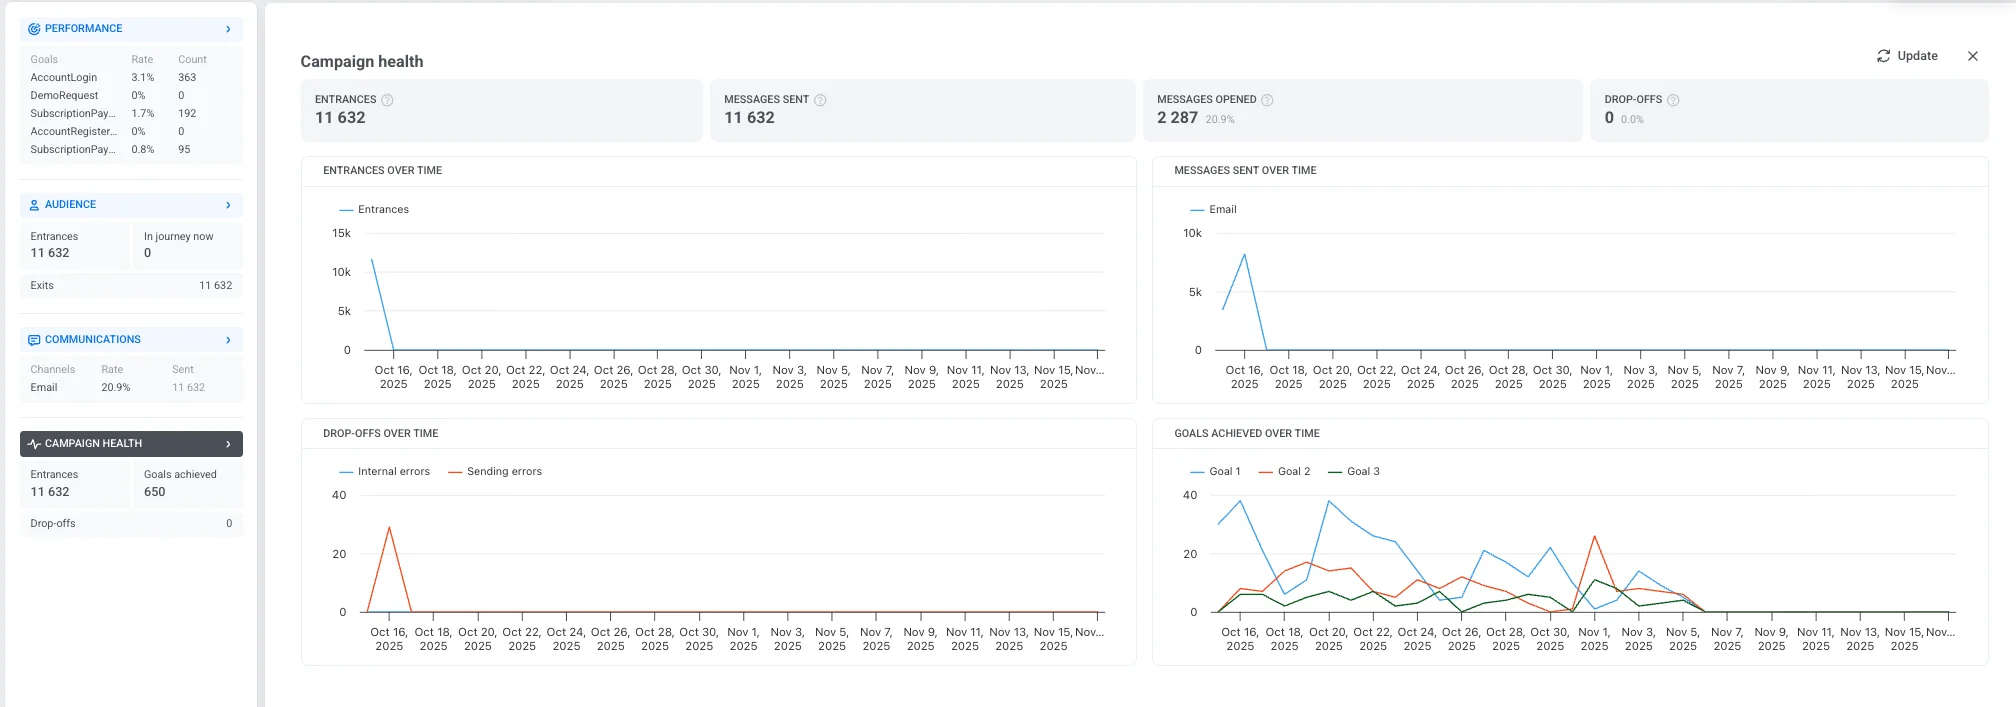
Incluye las siguientes métricas clave:
| Entradas | Número total de usuarios que entraron en la campaña durante el período de tiempo seleccionado, incluyendo entradas repetidas. |
| Mensajes enviados | Número total de mensajes enviados dentro del journey. |
| Mensajes abiertos | El número y porcentaje de mensajes que fueron abiertos por los usuarios. |
| Abandonos | El número de usuarios eliminados de la campaña debido a problemas internos. |
Los gráficos a continuación ayudan a visualizar tendencias y comportamientos clave a lo largo de la duración de la campaña:
-
Entradas a lo largo del tiempo Muestra el número de usuarios que entran en la campaña cada día.
-
Mensajes enviados a lo largo del tiempo Muestra el volumen diario de entrega de mensajes a través de diferentes canales.
-
Abandonos a lo largo del tiempo Rastrea cuándo y por qué los usuarios salieron de la campaña, categorizados por:
-
Errores internos: Problemas relacionados con la lógica o las condiciones del sistema.
-
Errores de envío: Fallos relacionados con la entrega de mensajes.
-
-
Objetivos alcanzados a lo largo del tiempo Muestra cuántos usuarios completaron los objetivos de la campaña durante el rango de tiempo seleccionado.
Exportar estadísticas de la campaña
Anchor link toPushwoosh le permite exportar estadísticas completas de la campaña para un rango de fechas seleccionado en formato CSV. Esto proporciona información detallada sobre el rendimiento de su campaña, ayudándole a analizar métricas clave y optimizar futuras campañas.
Dependiendo de sus necesidades, puede exportar datos para un solo journey, múltiples journeys con diferentes estados o categorías, o incluso todos los journeys a la vez.
Para exportar las estadísticas de la campaña:
- Vaya a la Lista de campañas.
- Localice la campaña deseada o utilice filtros para acotar sus journeys según el estado, la categoría u otros criterios. El archivo CSV exportado reflejará estos filtros. Luego, haga clic en Exportar estadísticas.
Para exportar las estadísticas de todos sus journeys, simplemente haga clic en Exportar estadísticas.

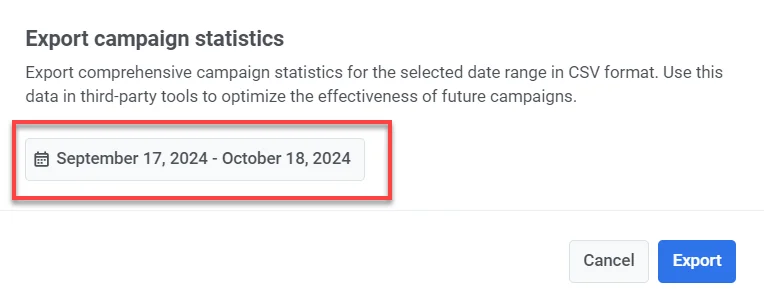
- Seleccione el rango de fechas para el que desea exportar los datos y haga clic en Exportar.
- Una vez que el archivo esté listo, haga clic en Descargar CSV.
Información incluida en la exportación CSV
El CSV contendrá la siguiente información:
- Title: Nombre de la campaña o journey.
- Status: Estado actual del journey (por ejemplo, finalizado, activo).
- Created: La fecha y hora en que se creó el journey.
- Category: La categoría de la campaña (por ejemplo, promoción de Black Friday, promoción de café).
- Type: El tipo de journey (por ejemplo, AudienceBased, TriggerBased).
- UUID: Un identificador único para el journey.
- Total Reach: Número total de usuarios a los que se dirige el journey.
- Unique Users: Número de usuarios únicos que recibieron mensajes en el journey.
- Users Inside: Número de usuarios que todavía están activos dentro del journey.
- Drop-off: Número de usuarios que salieron o abandonaron el journey.
- Total Sends: Número total de mensajes enviados a través de todos los canales (push, email, SMS, etc.).
- Avg CTR: Tasa de clics promedio en todos los tipos de mensajes.
- Goals: Número de usuarios que alcanzaron los objetivos definidos en la campaña.
- Push Sends: Número de notificaciones push enviadas en el journey.
- Push CTR: Tasa de clics para las notificaciones push.
- Email Sends: Número de mensajes de correo electrónico enviados en el journey.
- Email CTR: Tasa de clics para los mensajes de correo electrónico.
- Email Clicks: Número total de clics en los enlaces de los correos electrónicos.
- Email Unsubscribes: Número de usuarios que se desuscribieron de su lista de correo electrónico.
- SMS Sends: Número de mensajes SMS enviados en el journey.
- SMS Deliveries: Número de mensajes SMS entregados con éxito.
- WhatsApp Sends: Número de mensajes de WhatsApp enviados en el journey.
- WhatsApp Opens: Número de mensajes de WhatsApp abiertos por los usuarios.
- In-App Shows: Número de mensajes in-app mostrados a los usuarios.
- In-App Interaction: Número de usuarios que interactuaron con los mensajes in-app (por ejemplo, hicieron clic en un botón).
- In-App Skips: Número de usuarios que omitieron o descartaron el mensaje in-app sin interactuar.