Push notification statistics
With Pushwoosh, you can effortlessly track how well your push notifications are performing, both individually and overall as a channel. This guide explains how to use Pushwoosh’s push notification analytics tools to monitor performance, identify trends, and optimize messaging strategy.
Track individual push message performance in Customer Journey
Anchor link toYou can easily track the performance of push notifications sent as part of your customer journey directly on the canvas. To view the metrics, simply hover over a message you want to track or turn on the Show metrics toggle in Canvas settings.
This will display the following performance data for each push notification in your journey.
| Goals reached | Indicates the number of users who reached the Conversion Goal at that specific point. |
|---|---|
| Opened | Displays the number of messages opened by users. |
| CTR | Represents the percentage of users who clicked on (opened) the push notification after receiving it. |
| Drop-offs | Represents the number of messages that couldn’t be sent for some reason (for example, if a user’s push token had expired) |
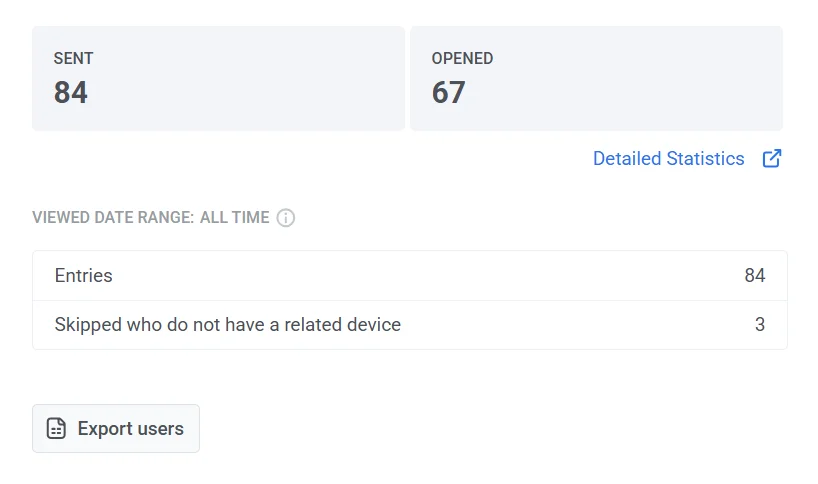
For more detailed insights into the effectiveness of a push notification, double-click on the message element on the canvas. This action will open a detailed statistics window, presenting key metrics specific to the message, including:
- Total number of messages sent
- Total number of messages opened
- Total number of entries
- The number of users who skipped this message element due to the absence of a related device.
View detailed push notification statistics
Anchor link toTo access detailed statistics for a push notification, follow these steps:
- Via One-time messages:
- Navigate to Campaigns > One-time messages.
- Select the message you want to analyze.
- Click on the message to open the statistics window.
- For notifications in a Journey:
- Open the Journey canvas.
- Select the Push element within the Journey.
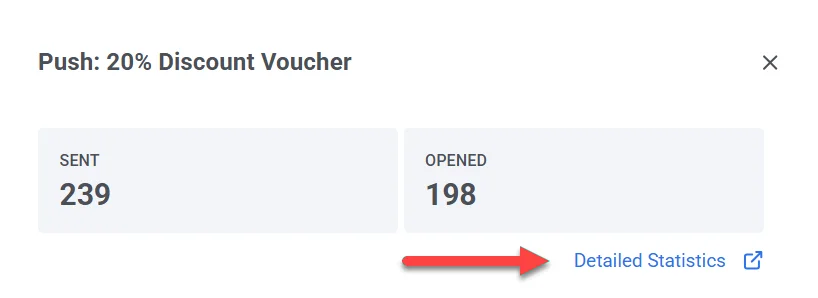
- Click Detailed statistics to view performance insights.
Detailed push notification statistics
Anchor link toUse Message stats to check how a specific send performed, from audience targeting to opens.

If a message went out on more than one channel (for example, iOS push and email in one send), channel tabs appear above Overview / Timeline / Errors so you can pick which channel to view. A single-channel message shows no channel tabs.
Overview tab
Anchor link toUse the Overview tab to check reach, delivery, and opens for this push.
If the message has the FAIL status, the Overview tab shows dashes instead of numbers and a notice with the reason it was not sent. See Why a message failed.
Campaign performance
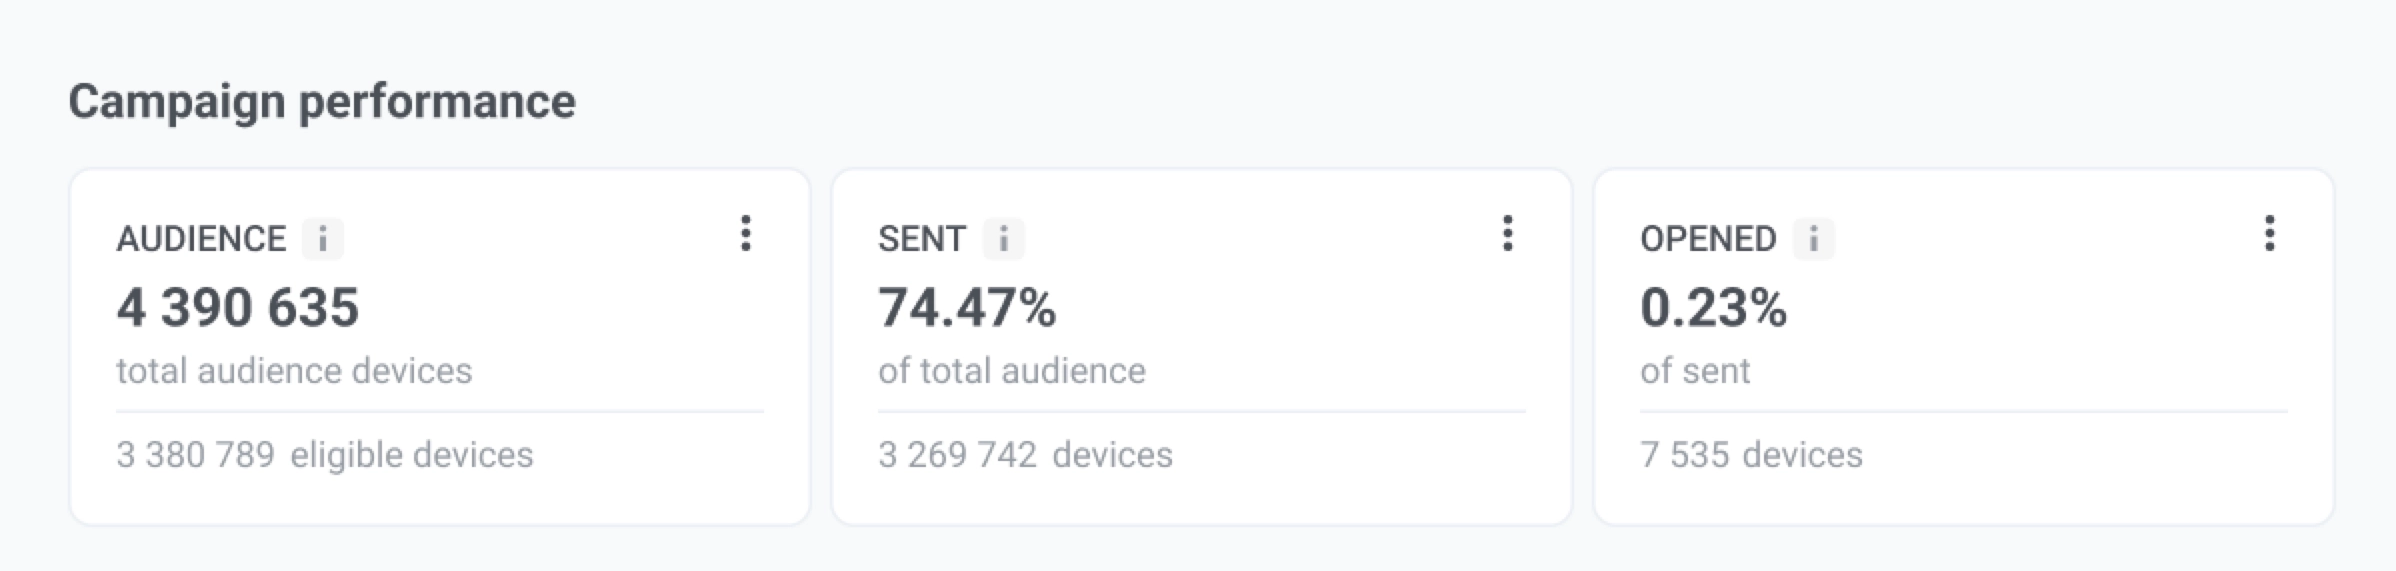
Anchor link toThese cards summarize how this push performed at a high level. The Opened card appears only when there’s open data for this send. Hover the ⓘ on any card to see the exact formula.
| Card | What it shows |
|---|---|
| Audience | Total audience devices for this send, and how many stayed eligible after exclusions (for example frequency capping or a control group). |
| Sent | Share of total audience that Apple, Google, or another platform accepted for sending, and that device count. Accepted means the platform took the send into work, not that the notification already appeared on the device. |
| Opened | Share of sent devices that opened the notification at least once, and that device count. |
Campaigns distribution
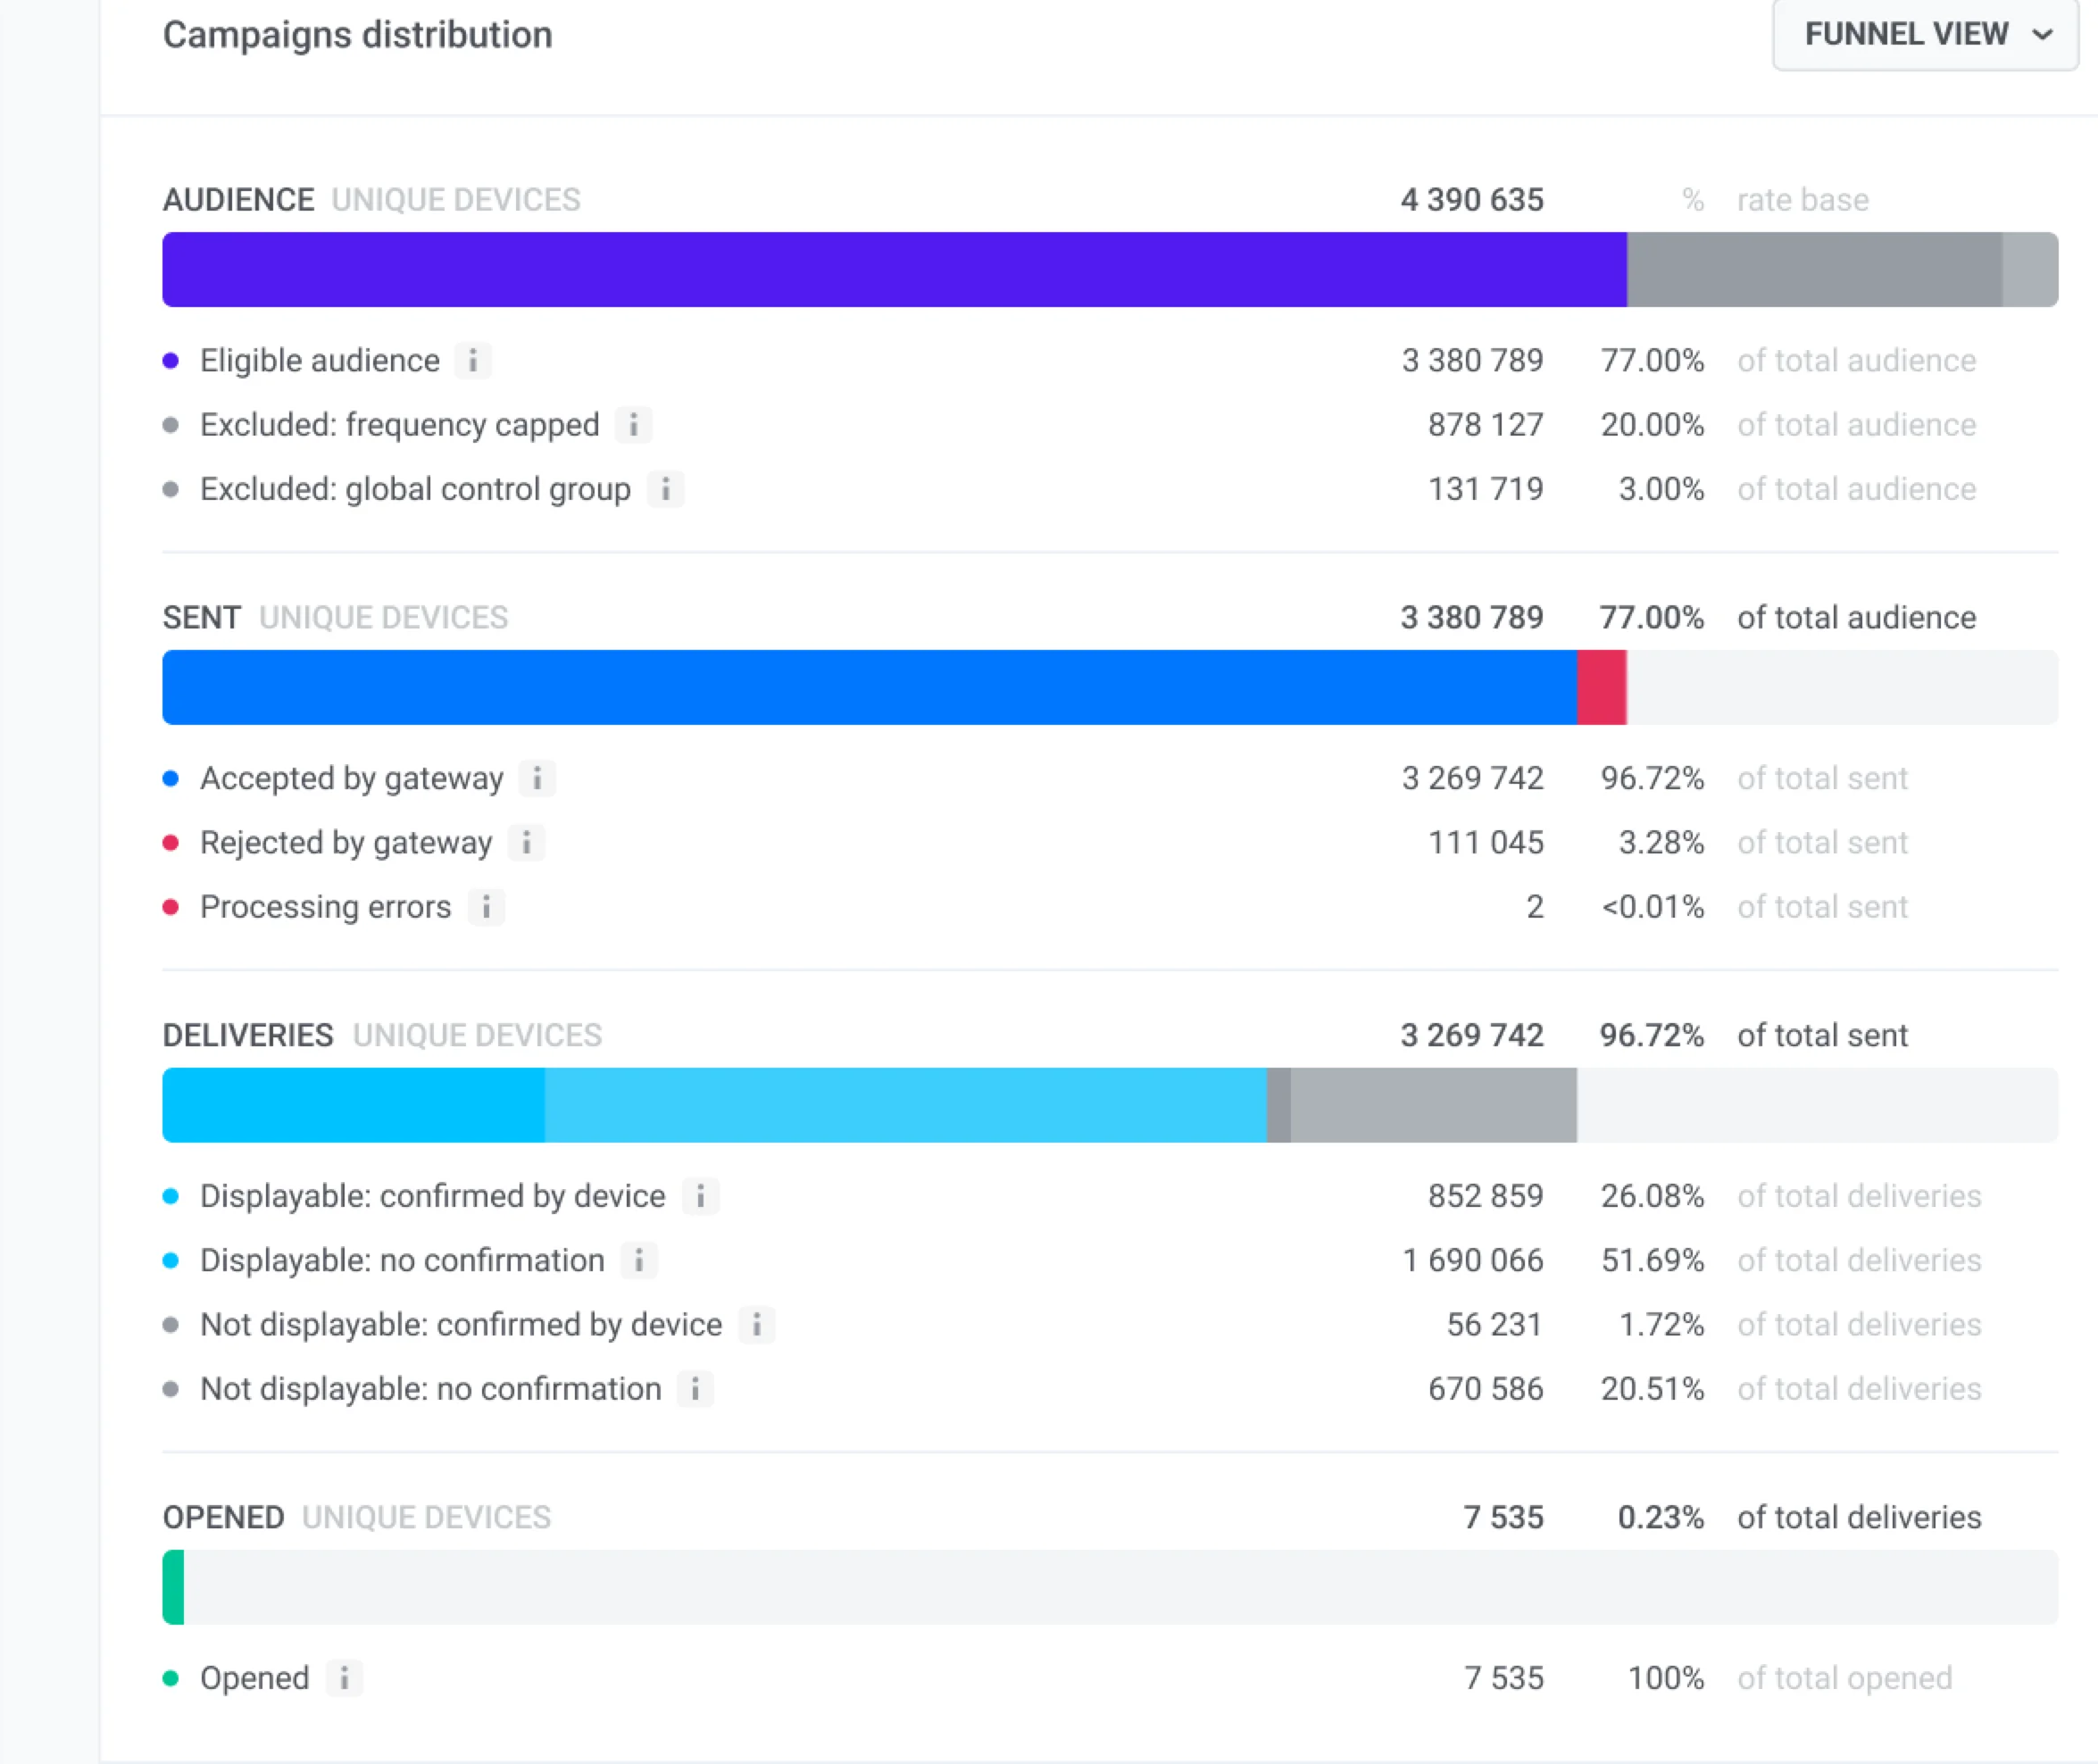
Anchor link toCampaigns distribution breaks this push into four steps:
- Audience: who you targeted
- Sent: who was accepted for sending
- Deliveries: who got a delivery confirmation
- Opened: who opened
You can view the same breakdown in two ways: as a funnel (default) or as a table. Use the view dropdown in the block header to switch between Funnel view and Table view. The table has one column per platform plus an All platforms summary column (hidden when there’s only one platform). The percentage column from the funnel view is not shown in the table.
Click Refresh to reload the numbers. Next to it, a timestamp like at 14:05 UTC · Sep 16, 2026 shows when stats last loaded.
How to read the funnel
Anchor link to- Follow the path down: Audience → Sent → Deliveries → Opened.
- The big percentage on a step is the share that reached it from the step above.
- The list under a step shows how those devices split (for example accepted vs rejected).
- If a row is missing, nobody fell into that group on this push.
- The Sent card and the Sent funnel step can disagree: the card counts everyone you targeted, the funnel step counts only eligible devices.
What each step includes
Anchor link toWho you targeted, split into eligible devices and who was left out by frequency capping or a global control group.
Eligible devices split into:
- Accepted by gateway: Apple, Google, or another platform took the push into work. This is not the same as the notification appearing on the device.
- Rejected by gateway: a platform or token problem. Details are on the Errors tab.
- Processing errors: a Pushwoosh-side failure. If this share is high, contact Pushwoosh Support.
Which accepted devices confirmed receipt. Confirmed means the device or platform reported delivery, not that the person saw the notification.
-
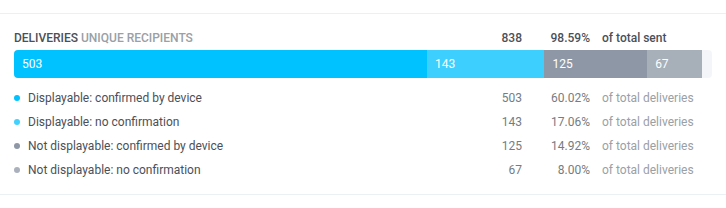
Mobile push younger than 30 days: four rows
- Displayable: confirmed by device
- Displayable: no confirmation
- Not displayable: confirmed by device
- Not displayable: no confirmation
Displayable means notifications were allowed on the device at send time. The push could have appeared. It does not mean the person saw it.
-
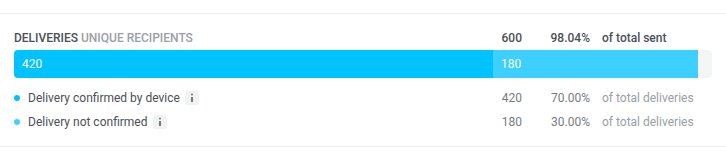
Web push, or mobile push older than 30 days: two rows (confirmed / not confirmed). After 30 days, devices with notifications off are included in the totals. A note under the step explains this.
-
Breakdown not available: a note under the step says so. Step totals still show.
-
Lists or dashboards show zero: on some accounts delivery can look like zero outside Message stats, while this funnel and Timeline still show numbers. Trust the Message stats funnel for that message.
Devices that opened the notification. Opens are tracked across the full Deliveries step, so the opened count can be higher than confirmed deliveries if an open is recorded without a delivery confirmation.
Timeline tab
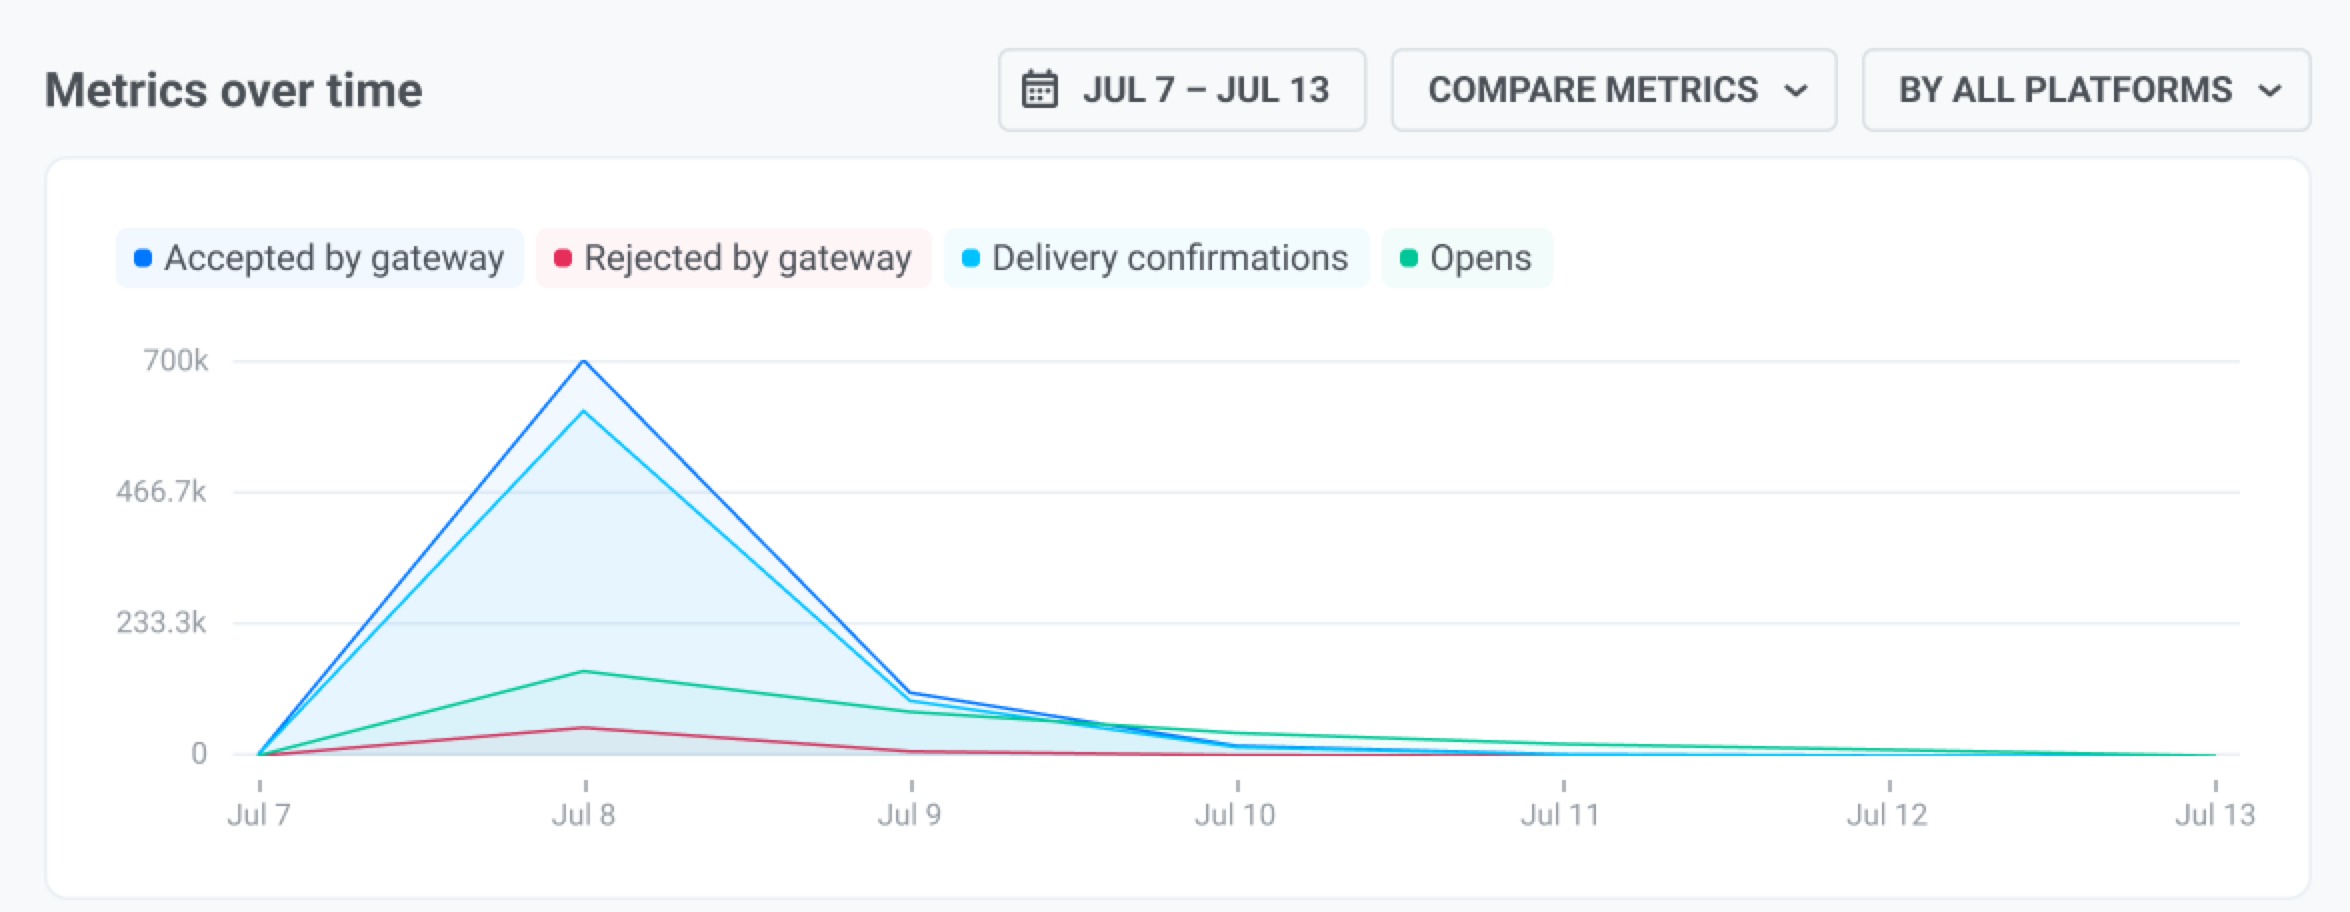
Anchor link toUse the Timeline tab to see how this push performed hour by hour (or day by day), not only the totals on Overview. For example, you can spot when opens came in after you sent, or when rejects piled up. The chart (Metrics over time) has four lines:
- Accepted by gateway: the delivery platform (Apple, Google, or another) took the push into work.
- Rejected by gateway: the platform rejected the send (for example a token or configuration problem).
- Delivery confirmations: the device or platform reported that the push was delivered. This is not the same as the person seeing it.
- Opens: someone opened the notification.
A summary table under the chart totals each metric for the selected window.
To configure the chart:
- Set the time range (for example All time, or a shorter window). Times are UTC. For a window under a day, the chart plots points by the minute. For a window from a day up to a month, it groups points by the hour. For longer windows, it groups by day (or a larger step).
- Choose Compare metrics to plot the four lines together, or Compare platforms to compare platforms for one metric.
- Use All platforms to keep every platform, or pick one platform to filter the chart and table.
These controls apply to the chart, the summary table, and the Events table below. They do not change the Overview cards or funnel.
Custom events after a tap on this push
Anchor link toThe Events table under the chart shows the custom events your app sent after users tapped this push. It fills in only if your app sends events to Pushwoosh.
Each event goes to the message the user last clicked within the 72 hours before the event:
- What counts as a click: A tap that opens the notification.
- Clicks on other messages: Clicks on all messages of the same app count, so an event that follows a tap on a later message goes to that later message, not to this one.
- Limits: One event goes to one message only.

| Column | What it shows |
|---|---|
| Event | The event name. |
| Hits | How many events went to this push. Every event the user sends after the tap counts, until the user clicks another message or 72 hours pass. |
| Unique | How many distinct users sent the event at least once. |
Events are matched to the message by User ID, not by device.
The Timeline controls change the table in two ways:
- Time range: filters the events, not the taps. A tap before the start of the range still counts for an event inside the range.
- Platform: filters the taps by the platform of the push. The event itself can come from any platform, for example a purchase on your website after a tap on an Android push.
Each row has an export icon. Click it to download the devices behind that row as CSV. The file follows the same last-click rule, so it matches the row.
Errors tab
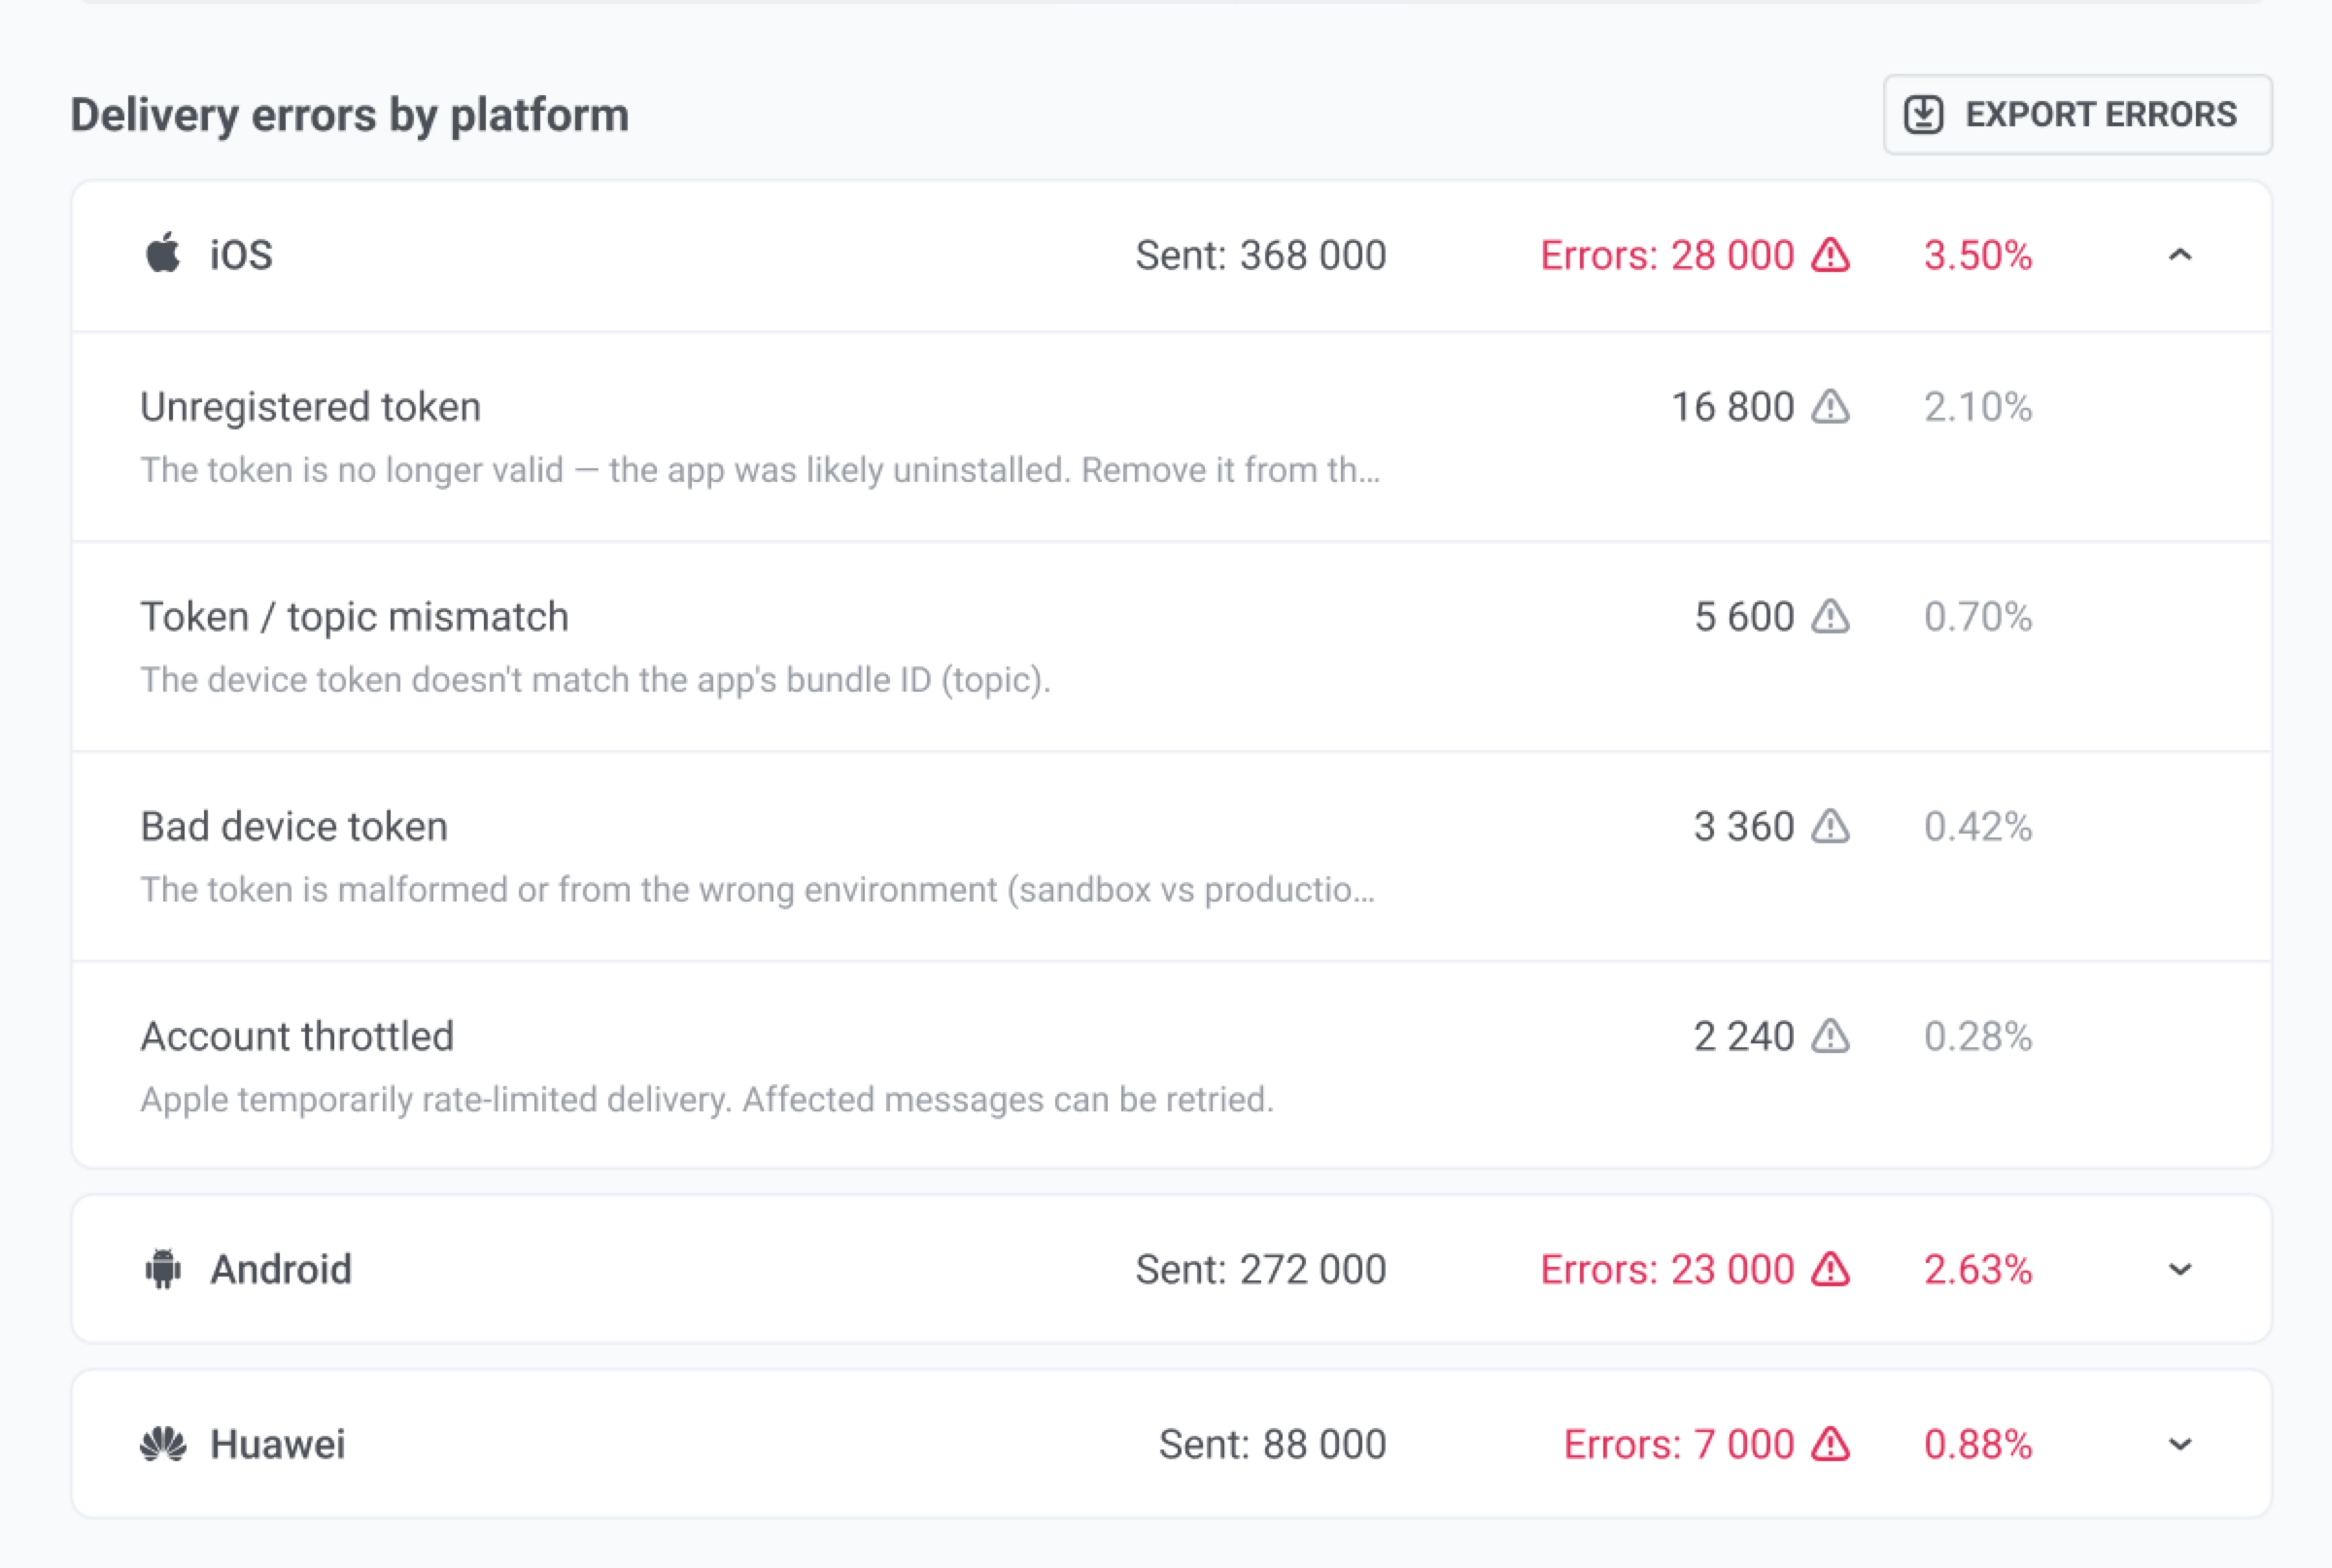
Anchor link toUse the Errors tab to understand why sends were rejected. The red badge on the tab shows the total of rejected sends plus Processing errors. If nothing failed, the tab shows an empty state instead of a zero.
See Message stats error categories and Sending errors for a full list of error types and what to do about them.
Content panel
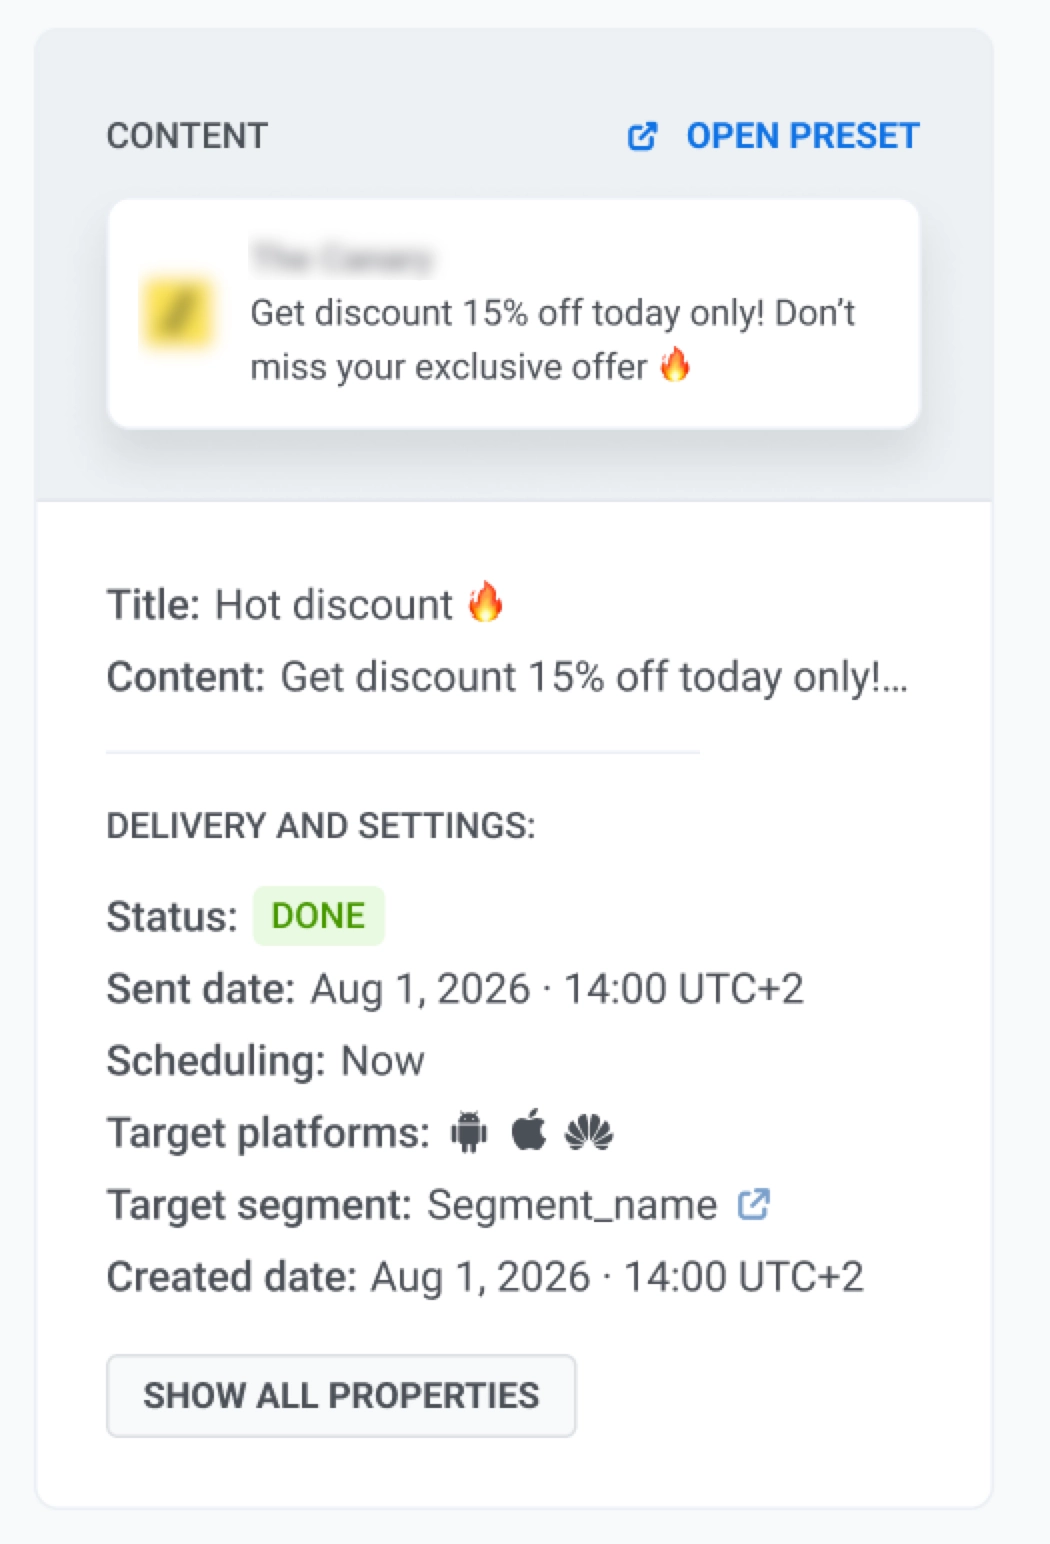
Anchor link toThe right-hand Content panel shows the notification as recipients saw it. Use it to verify message content and confirm delivery settings.
- To view or edit the push preset, click Open preset. See Push presets.
- If the message was sent in more than one language, use the chips below the preview to switch between them.
Delivery and settings below the preview shows how this send was configured.
- Status: whether this send finished (Done) or is still processing
- Sent date: when this message actually went out
- Scheduling: immediate, selected time, or Best time
- Target segment: the audience you set
- Target platforms: the platforms selected, for example iOS, Android, or Web
Click Show all properties only if you need technical details. Request ID is useful for Support or your developers when tracing this exact send. Journey and automated sends often have no Request ID. Skip it when you are only checking performance.
Copy the message code
Anchor link toTo get an ID for Support or your developers when tracing this push:
- At the top of the page, click Message code.
- The ID is copied to your clipboard.
You usually do not need it to read the stats.
Export recipients and create a segment
Anchor link toExport recipients
Anchor link toExporting recipients requires the Personal data permission in your role.
To download recipients as CSV from the top of the page:
- Click Export stats.
- Confirm the download.
You can also click Export list from:
- A card’s three-dot menu (⋮) on Overview
- An error row on the Errors tab
- An event row in the Events table on Timeline (export icon)
Both Export stats and Export list pull from the same per-recipient log, which covers only the last 30 days. Older recipients are not in the file. The confirmation dialog states this limit before the download starts.
What the file contains
Anchor link toThe file has one row per recipient device:
| Column | Meaning |
|---|---|
hwid | Device identifier |
user_id | UserID of the device, if it is set |
platform | Device platform, for example iOS, Android, or Chrome |
send_timestamp | When Pushwoosh handed the push to the platform provider (APNs, FCM, and so on) |
delivery_timestamp | When the device confirmed delivery. Empty if delivery is not tracked for that platform |
open_timestamp | When the recipient opened the push. Empty if they did not open it |
send_error | Name of the error that stopped the send. Empty for a successful send |
pae | false only for an Unshowable send (see below). true for every other outcome, including a row with no send at all — it isn’t a live read of the device’s permission state |
send_status | Result of the send: Success, Unshowable, or the error name |
Send statuses
Success: the provider accepted the push, and the device can show it.Unshowable: the provider accepted the push, but the recipient has notifications turned off in the OS settings, so no banner appears. This is not a delivery failure: the message still reaches the app, and if the send has Save message to Inbox enabled, the recipient can still find and open it in Message Inbox. Pushwoosh counts unshowable sends as successful sends and reports them separately as Unshowable sends.- Any other value is the provider’s specific rejection reason, for example
Unregisteredfor an iOS token that is no longer valid. The CSV spells each name with spaces (Frequency Capping). The platform pages under Sending errors use the same name without spaces (FrequencyCapping). Match the row’splatformcolumn to the right page for the full list of codes and what to do about them.
Create a segment from Sent or Opened
Anchor link toUse this when you want to message the same devices again — for example, everyone who opened this push, or everyone the platform accepted for sending.
- On Overview, find the Sent or Opened card.
- Click the three-dot menu (⋮) on that card.
- Click Create segment.
- In the Create segment dialog, enter a name in Segment name.
- Click Create.
The new segment includes the devices on that card. You can select it later when you send another push.
The Audience card has Export list only — not Create segment.
Understand the overall performance of push notifications
Anchor link toYou can view overall push notification analytics in the Dashboards section to assess trends in engagement and reach.
For this, navigate to Statistics > Dashboards > Push notifications
The dashboard provides comprehensive insights into the overall performance of push notifications, featuring metrics like:
- Recipients
- Push CTR
- Push sends
- Push deliveries
- Push opens
- Installs
- Uninstalls
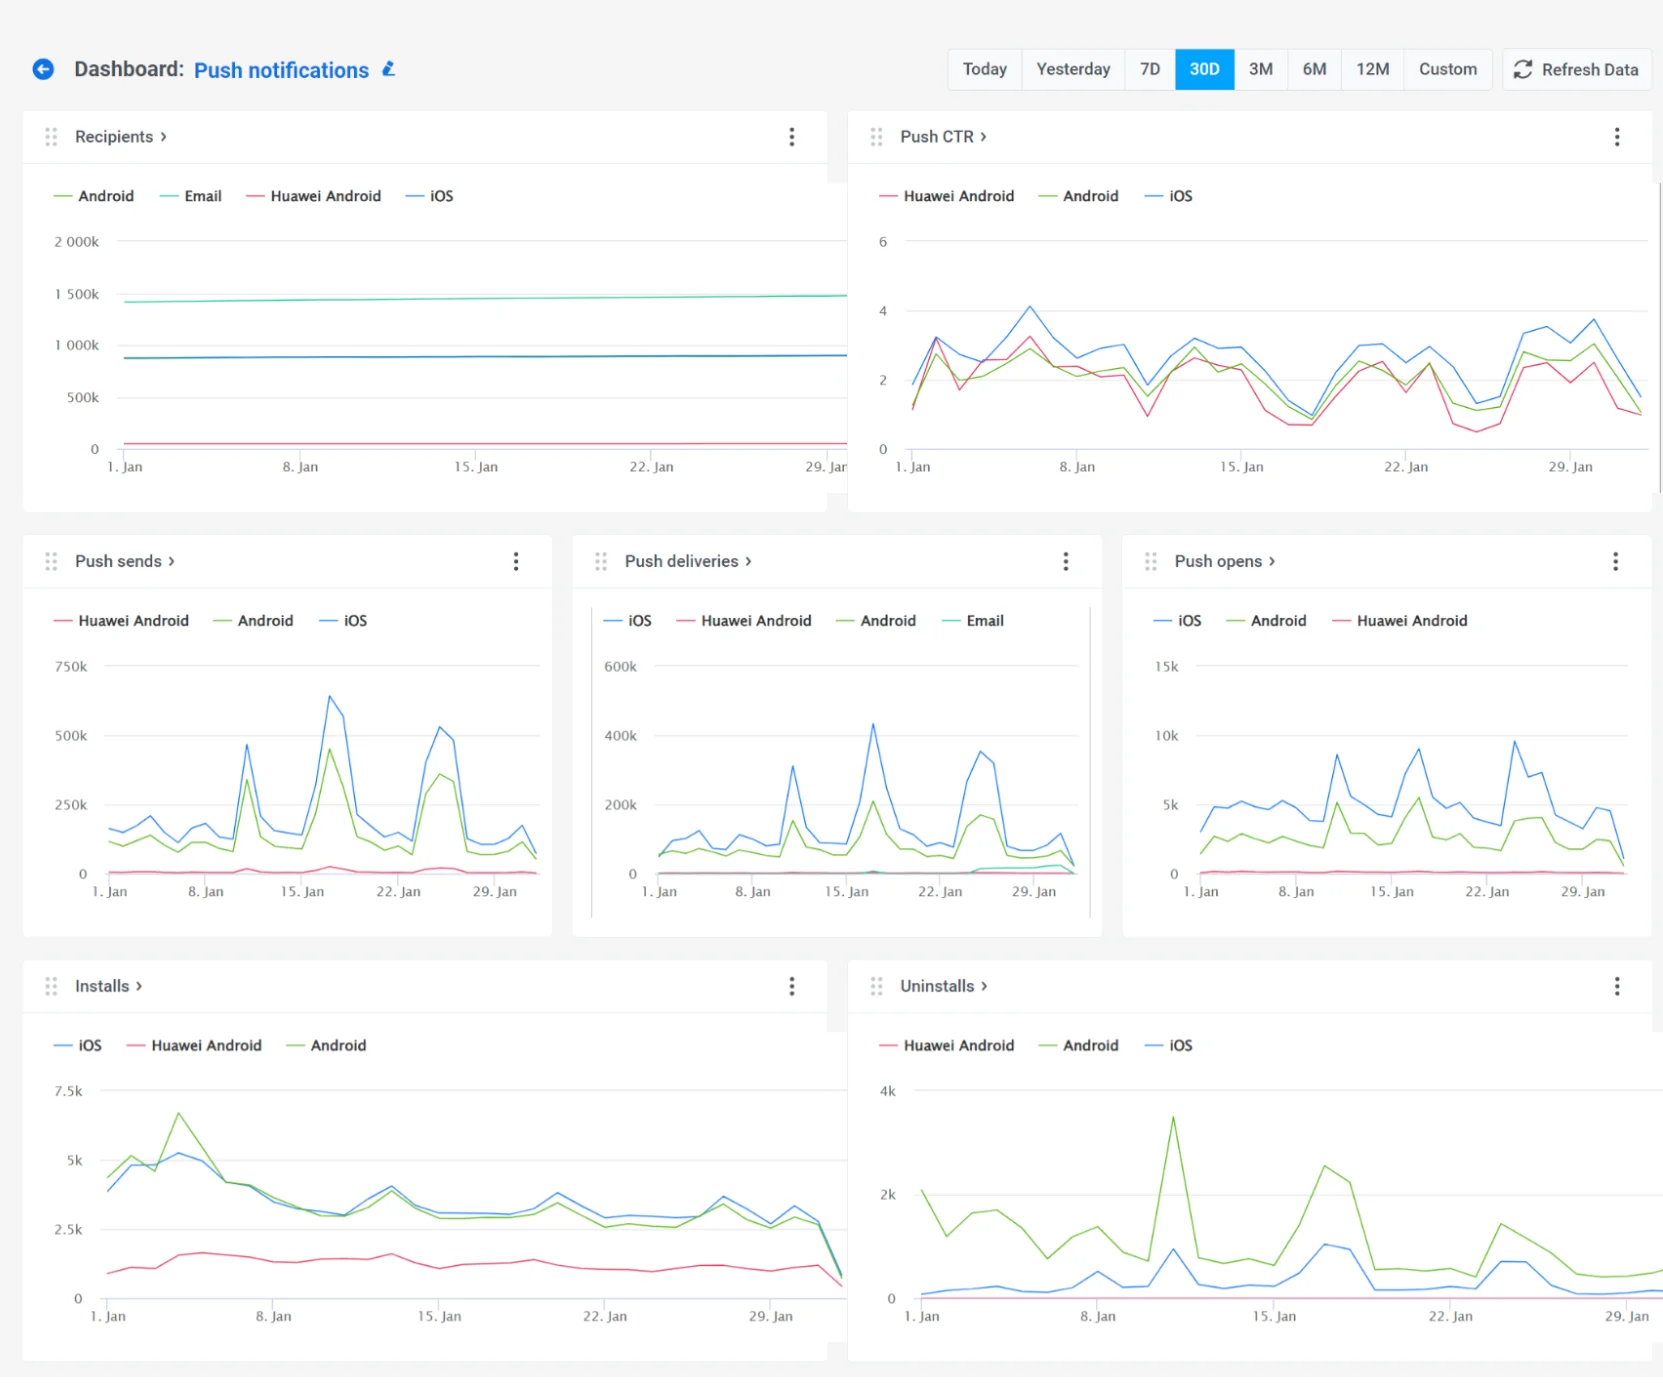
Also, you can customize the dashboard to fit your needs by adding or removing specific metrics, or create a custom dashboard entirely tailored to your campaigns. Learn more