Email statistics
In Pushwoosh, email analytics provide valuable insights into the performance of your messages. You can evaluate individual email performance and track overall trends across your email campaigns.
Track individual email message performance
Anchor link toYou can monitor the performance of each email message within a customer journey directly on the Journey canvas.
To view statistics for a message, open Canvas settings and turn on Show metrics, or hover over the message element to see the stats.
Below the email message element, you will see such metrics as:
| Goals Reached | Indicates the number of users who reached the Conversion Goal at this specific point. |
| Opened | Number and percentage of unique users who opened the email (each user counted once). |
| CTR | Represents the percentage of users who clicked on the message. |
| Drop-offs | Represents the number of messages that couldn’t be sent. |
For a detailed view of individual message effectiveness, double-click on a message element on the canvas. A statistics window will pop up, displaying key metrics, such as:
- Number of sent messages
- Number of opened messages
- Number of clicks
- Number of recipients who have unsubscribed
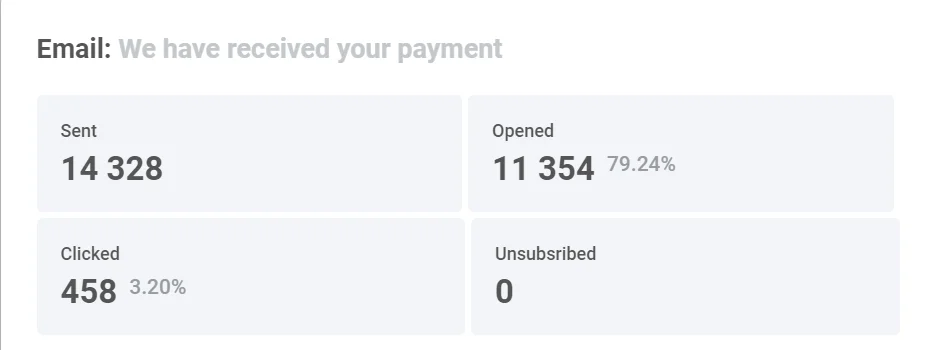
To see the reasons for drop-offs and the number of drop-offs for each cause, expand the Drop-offs block.

Detailed email statistics
Anchor link toTo view detailed statistics for an email message, click Detailed Statistics in the journey email element. Alternatively, open Campaigns → One-time messages, find the message, and click it.
Use Message stats to check how a specific email performed, from audience targeting to opens and clicks.
The page tabs are Overview, Clicks, Timeline, and Errors. If the same send also went to other channels, channel tabs appear above them so you can pick which channel to view. A single-channel message shows no channel tabs.
Overview tab
Anchor link toUse the Overview tab to check reach, delivery, opens, and (for broadcast sends) clicks and unsubscribes for this email.
If the message has the FAIL status, the Overview tab shows dashes instead of numbers and a notice with the reason it was not sent. See Why a message failed.
Campaign performance
Anchor link toStart here to see how far this email got: who you reached, how many opens and clicks you got, and whether people unsubscribed or marked spam. Hover the ⓘ on any card for the exact formula.
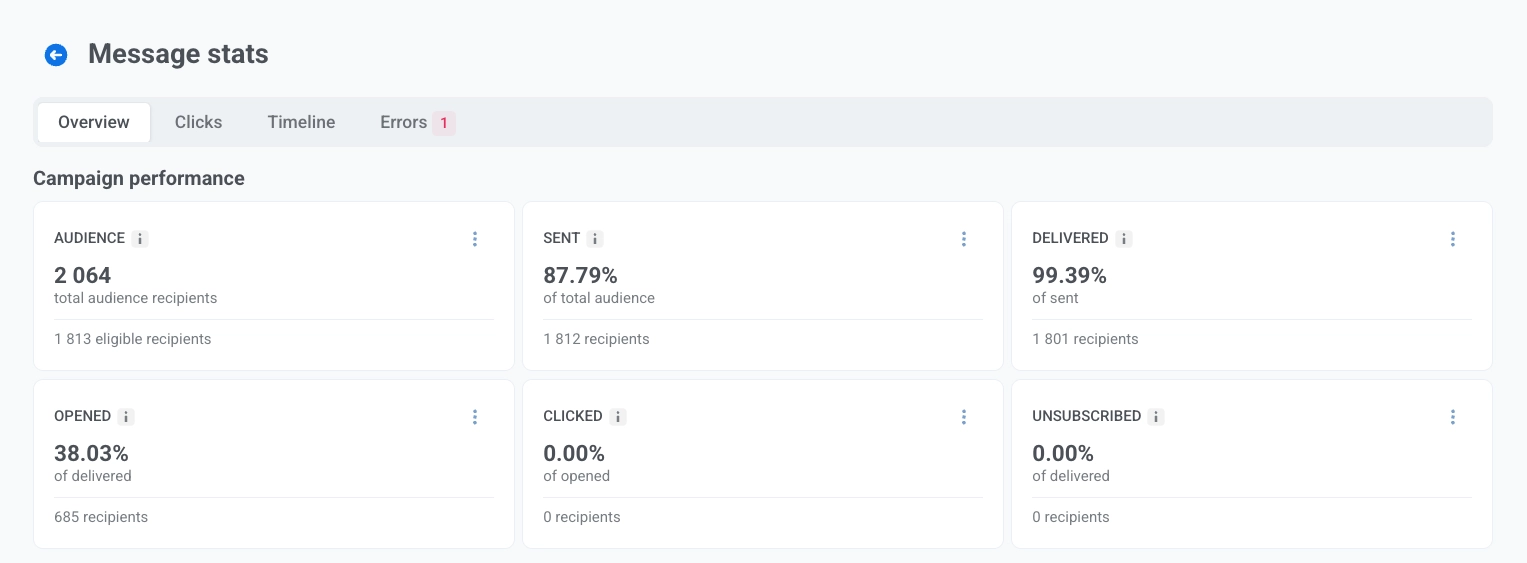
| Card | What it shows |
|---|---|
| Audience | How many people you targeted for this send, and how many stayed eligible after exclusions. |
| Sent | Of everyone you targeted, what share the email provider accepted for sending. Accepted means the provider took the message into work, not that it reached the inbox. |
| Delivered | Of those accepted for sending, what share did not hard- or soft-bounce. Different from the Deliveries funnel step below, which tracks delivery confirmations. |
| Opened | Of delivered recipients, what share opened the email at least once. |
| Clicked | Of people who opened (including Apple Mail Privacy Protection machine-only opens), what share clicked a link. Someone who later unsubscribed or marked spam still counts here. |
| Unsubscribed | Of delivered recipients, what share unsubscribed or marked the email as spam. Spam complaints count here too, because the mailbox provider unsubscribes them. This can be higher than the funnel row for “unsubscribed without clicking”. |
Campaigns distribution
Anchor link toCampaigns distribution breaks this email into steps:
- Audience: who you targeted
- Sent: who was accepted for sending
- Deliveries: who got a delivery confirmation
- Opened: who opened
- Interactions: who clicked, unsubscribed, or complained (broadcast sends only)
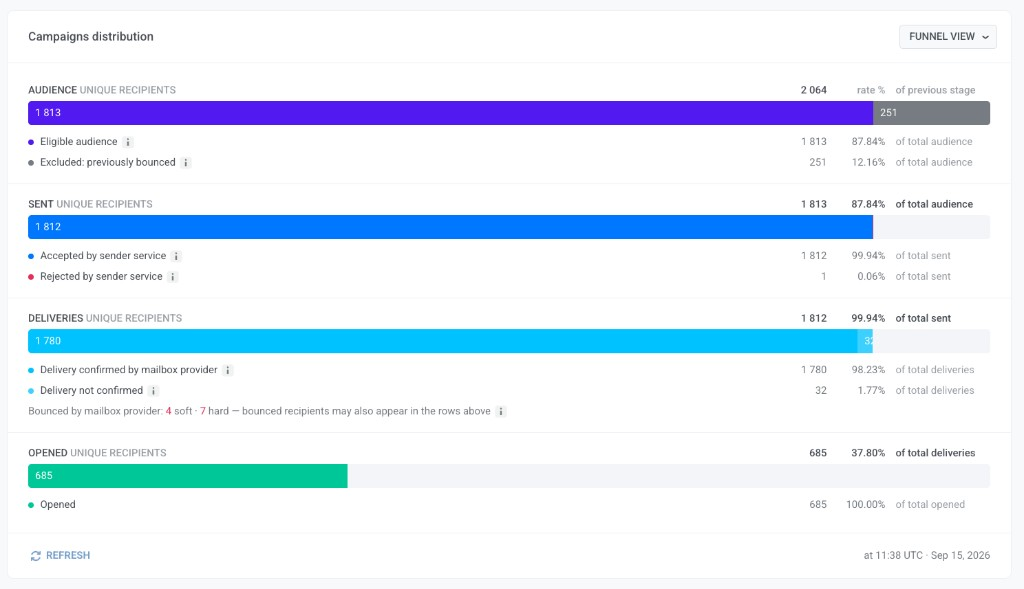
Transactional emails have no Interactions step, and their Clicked and Unsubscribed cards above read zero as well.
You can view the same breakdown in two ways: as a funnel (default) or as a table. Use the view dropdown in the block header to switch between Funnel view and Table view.
Click Refresh to reload the numbers.
How to read the funnel
Anchor link to- Follow the path down: Audience → Sent → Deliveries → Opened → Interactions (Interactions only on broadcast sends).
- The big percentage on a step is the share that reached it from the step above.
- The list under a step shows how those people split (for example accepted vs rejected).
- If a row is missing, nobody fell into that group on this email.
- The Sent card and the Sent funnel step can disagree: the card counts everyone you targeted, the funnel step counts only eligible people.
What each step includes
Anchor link toWho stayed eligible, and who was left out.
- Exclusions can include previously unsubscribed, bounced, or complained; frequency capped; filtered by category; global control group.
- Excluded: previously bounced is from an earlier send.
- Bounces from this send show under Deliveries.
Eligible people split into:
- Accepted by sender service: provider took the send into work, not that it reached the inbox.
- Rejected by sender service: see the Errors tab.
- Processing errors: Pushwoosh-side failure.
Delivery confirmations (not opens): confirmed vs not confirmed.
- Hard and soft bounces for this send appear as a note under the step. Do not add or subtract them from the confirmation rows.
- Below it, bounces are split by reason, hard bounces first, then soft. Each reason shows the number of addresses and their share of sent emails. Older emails don’t show this split. See Bounces by reason.
- A bounce can also show in confirmed (or opened) if the provider confirmed first and bounced later.
- Different from Excluded: previously bounced and from the Delivered card.
- For
icloud.com,me.com, andmac.com, the confirmed share can look lower than actual because Apple does not always return delivery confirmations. That is an Apple limitation, not a failed delivery.
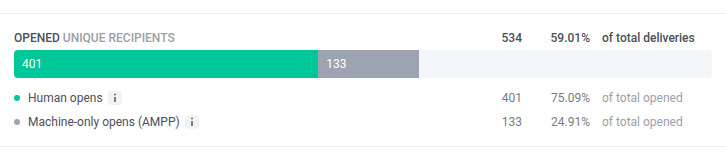
Opens across the full Deliveries step (opens can exceed confirmed deliveries).
-
First 60 days: Human opens and Machine-only opens (AMPP).
-
After 60 days: the total still shows, but without the Human opens / Machine-only opens (AMPP) split. The total now includes machine-only opens indistinguishably from human opens, so do not compare or add it to the earlier split.

Each person in exactly one row:
- Clicked only
- Clicked and unsubscribed
- Clicked and complained
- Unsubscribed without clicking
- Complained without clicking
A complaint wins over an unsubscribe. Unsubscribes and complaints can appear even when no open was tracked.
Clicks tab
Anchor link toUse the Clicks tab to see which links in this email got clicks. Link clicks lists them by click count, sorted by clicks (highest first).
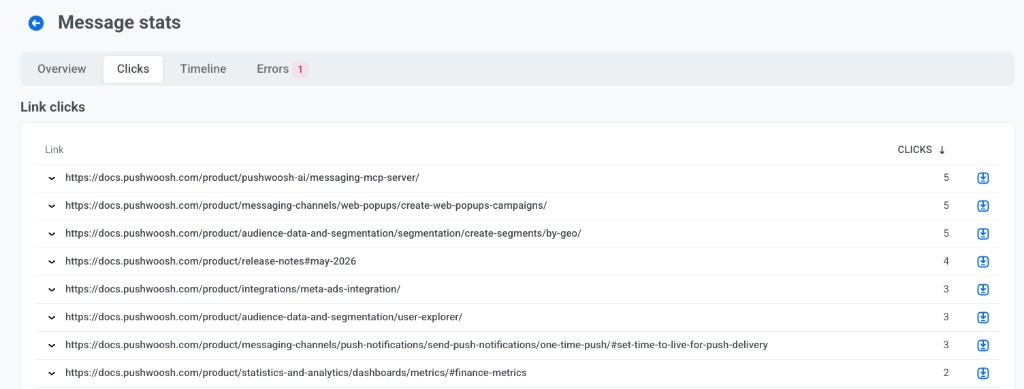
- A row is one URL, without its query string. Two links to the same URL, even with different anchor text, combine into one row. Expand a row to see it broken down by query parameters.
- Click the download icon on a row to export that link’s click list as CSV.
Click map
Anchor link toNext to the Link clicks table, this tab also shows a click map: the email preview with its links shaded by their share of clicks, darker links getting more of them. The map shows on a single message’s stats and on an aggregated campaign view alike, including a campaign that a journey point sends to. On an aggregated view, the map pools clicks from every message the campaign sent onto that one preview.
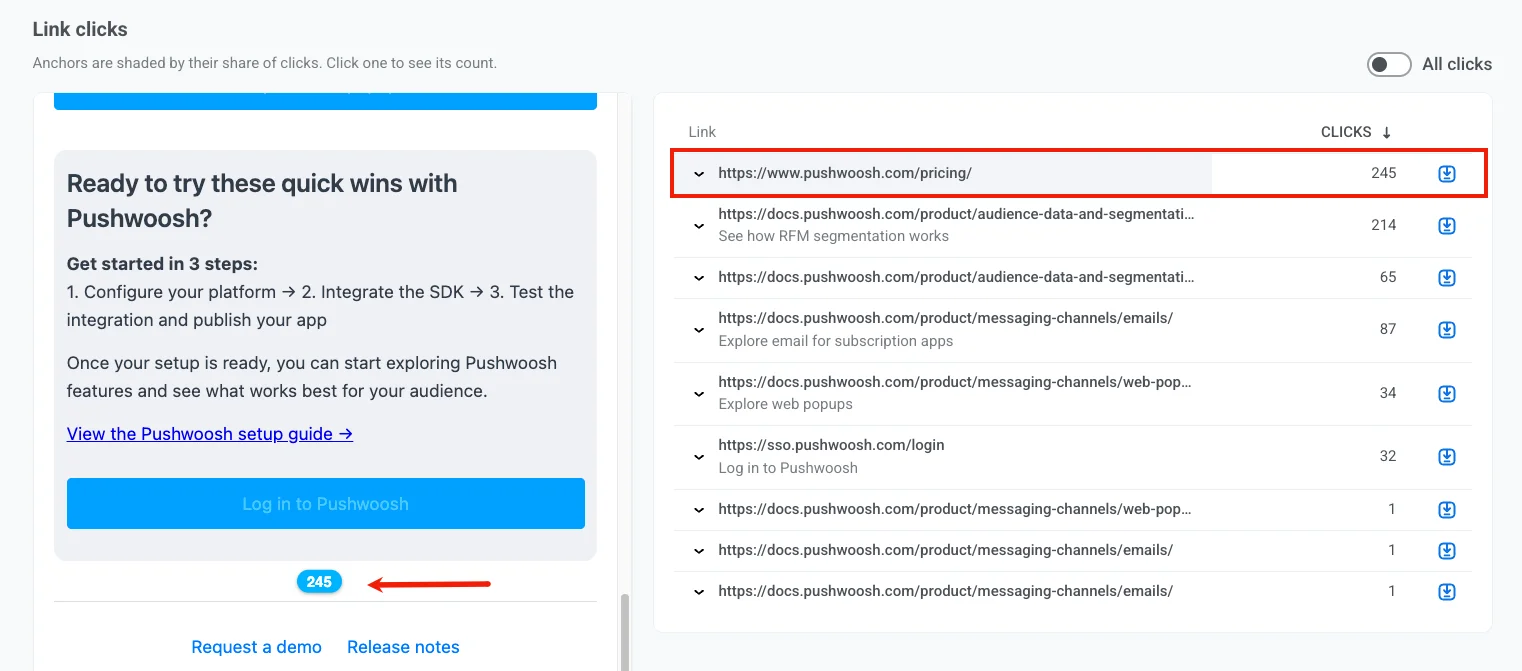
- Click a shaded link on the map to select it: the link gets a blue outline and its exact click count appears in a badge next to it.
- Click a row in the Link clicks table to select the same link the other way: the row highlights gray, and the matching link’s badge appears on the map.
- Toggle All clicks above the map to switch between unique and total clicks.
- A link the map can’t place on the current template (removed or changed since some of the counted clicks happened) is left off the preview. A caption above the map states how many clicks and links that affects.
- When several identical links pool into one badge, a separate caption above the map states how many badges that affects.
Timeline tab
Anchor link toUse the Timeline tab to see how this email performed hour by hour (or day by day), not only the totals on Overview. For example, you can spot when opens came in after you sent, or when rejects piled up. The chart has four lines:
- Accepted by sender service: the email provider took the message into work.
- Rejected by sender service: the provider rejected the send.
- Delivery confirmations: the mailbox provider reported delivery. This is not an open.
- Opens: someone opened the email.
A summary table under the chart totals each metric for the selected window.
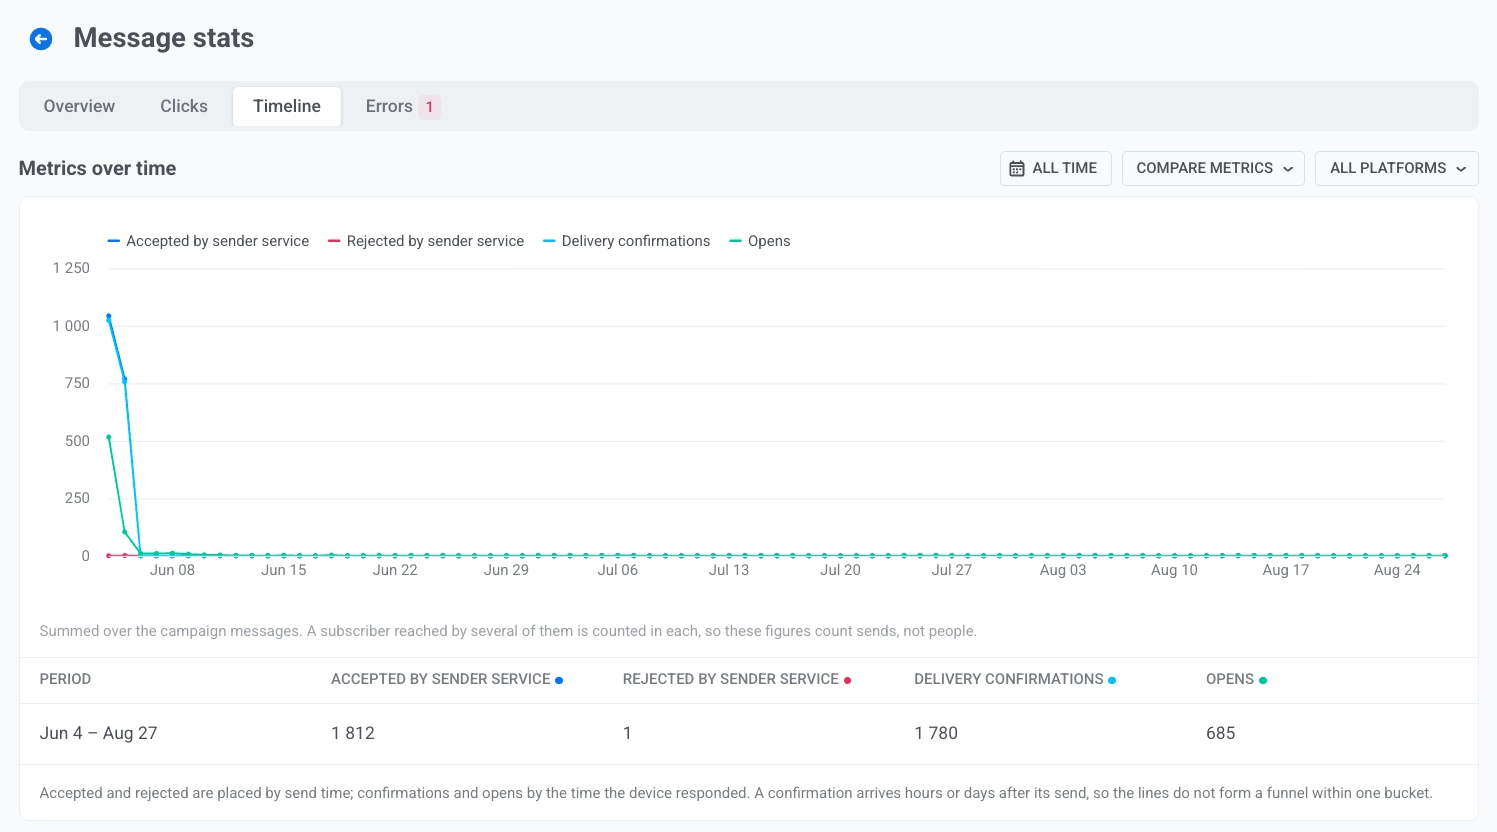
To configure the chart:
- Set the time range. Times are UTC. For a window under a day, the chart plots points by the minute. For a window from a day up to a month, it groups points by the hour. For longer windows, it groups by day (or a larger step).
- Choose Compare metrics to plot the four lines together, or Compare platforms to compare platforms for one metric.
- Use All platforms to keep every platform, or pick one platform to filter the chart and table.
These controls apply to the chart, the summary table, and the Events table below. They do not change the Overview cards or funnel.
Custom events after a link click in this email
Anchor link toThe Events table under the chart shows the custom events your app or website sent after recipients clicked a link in this email. It fills in only if your app or website sends events to Pushwoosh.
Each event goes to the message the user last clicked within the 72 hours before the event:
- What counts as a click: A click on a link in the email. Opening the email and clicking the unsubscribe link don’t count.
- Clicks on other messages: Clicks on all messages of the same app count, so an event that follows a click on a later message goes to that later message, not to this one.
- Limits: One event goes to one message only.
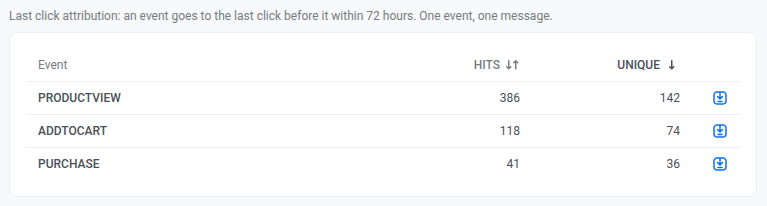
| Column | What it shows |
|---|---|
| Event | The event name. |
| Hits | How many events went to this email. Every event the user sends after the click counts, until the user clicks another message or 72 hours pass. |
| Unique | How many distinct users sent the event at least once. |
Events are matched to the message by User ID, not by device. If an email address is registered under a different User ID than the one your app or website uses for the same person, that person’s events show as 0 here.
The time range filters the events, not the clicks. A click before the start of the range still counts for an event inside the range.
Each row has an export icon. Click it to download the devices behind that row as CSV. The file follows the same last-click rule, so it matches the row.
Bounces and delivery errors
Anchor link toThe Errors tab shows why this email failed for some recipients, bounces grouped by reason, and what each email error means.
Content panel
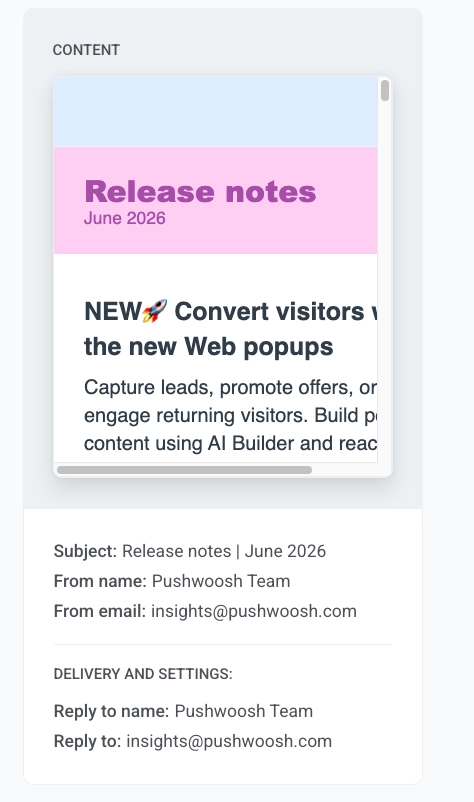
Anchor link toThe right-hand Content panel shows the email subject line, from name, and from email, above a preview of the message as recipients saw it. Click Open preset to view or edit the email template.
Delivery and settings below the preview shows how this send was configured.
- Status: whether this send finished (Done) or is still processing
- Sent date: when this message actually went out
- Scheduling: immediate or selected time
- Target segment: the audience you set. Click the segment link to open or edit it
Copy the message code
Anchor link toTo get an ID for Support or your developers when tracing this email:
- At the top of the page, click Message code.
- The ID is copied to your clipboard.
You usually do not need it to read the stats.
Export recipients and create a segment
Anchor link toExport recipients
Anchor link toExporting recipients requires the Personal data permission in your role.
To download recipients as CSV from the top of the page:
- Click Export stats.
- Confirm the download.
To export a specific group instead:
- On Overview, open the three-dot menu (⋮) on a card, then click Export list.
- On the Clicks tab, click the download icon on a link row.
- On the Errors tab, click the download icon on an error row.
Both Export stats and Export list pull from the same per-recipient log, which covers only the last 30 days. Older recipients are not in the file. The confirmation dialog states this limit before the download starts.
Create a segment from Sent, Delivered, Opened, or Clicked
Anchor link toUse this when you want to email the same people again, for example everyone who opened or clicked this email, or everyone the provider accepted for sending.
- On Overview, find the Sent, Delivered, Opened, or Clicked card.
- Click the three-dot menu (⋮) on that card.
- Click Create segment.
- In the Create segment dialog, enter a name in Segment name.
- Click Create.
The new segment includes the people on that card. You can select it later when you send another email.
Gain insights into email performance trends
Anchor link toProject overview
Anchor link toTo assess the overall performance of your email campaigns, navigate to Statistics > Project Overview. Here, you can view the total number of emails sent, delivered, and opened within a selected period, allowing you to compare email performance with other channels.
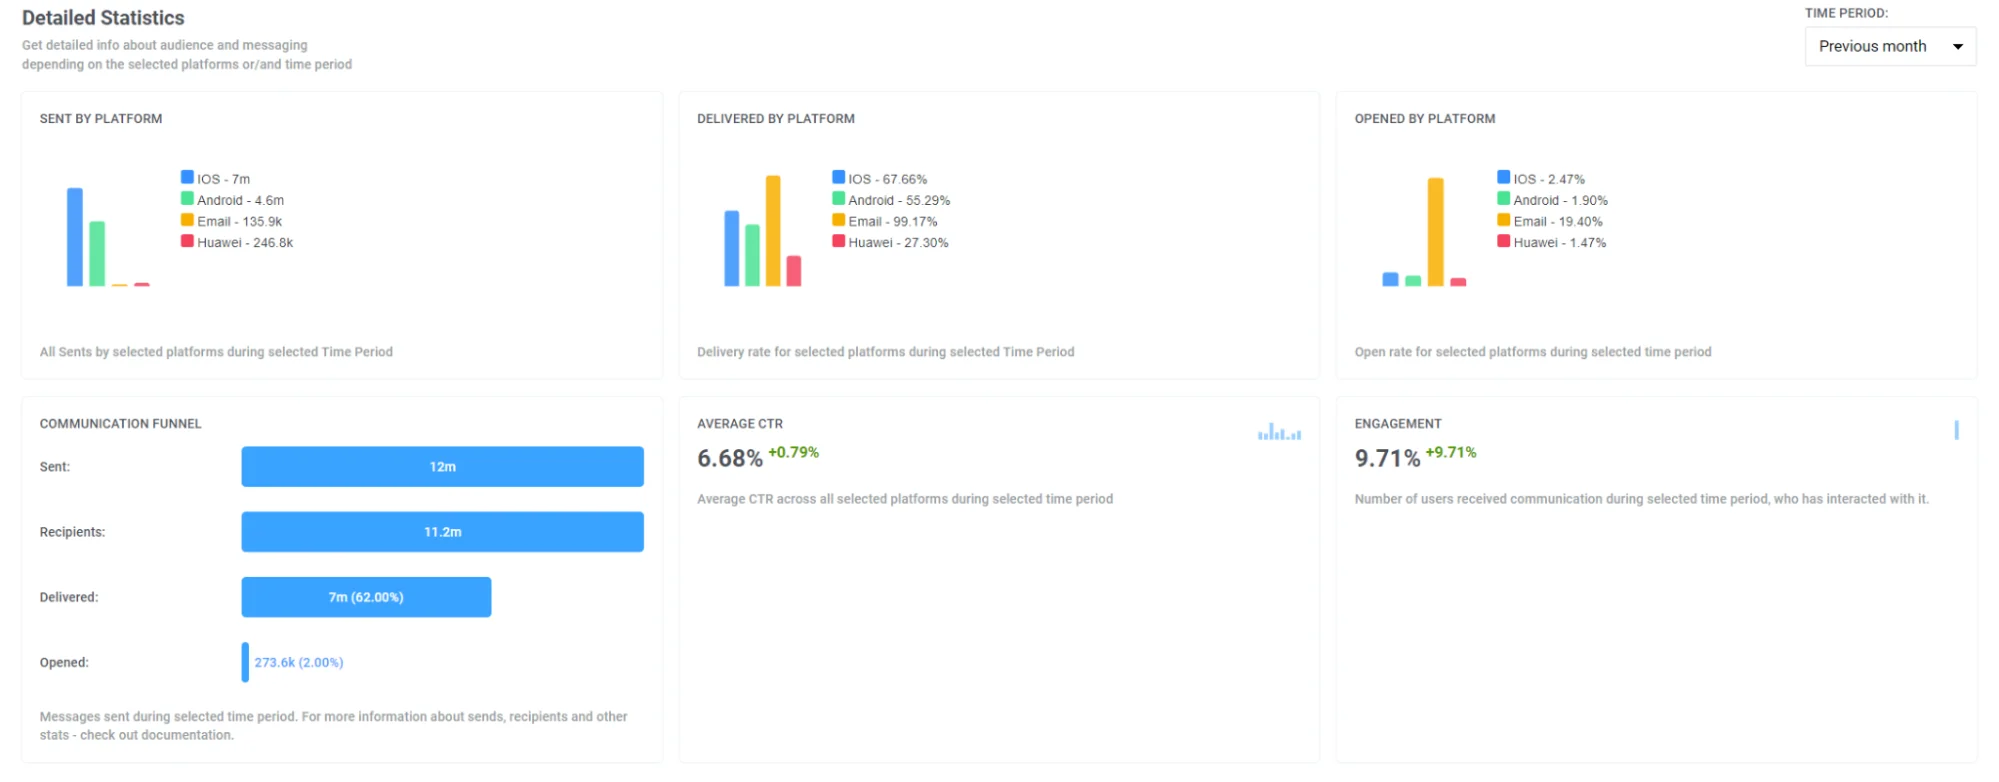
Furthermore, on this page, you’ll find a breakdown of key email metrics such as:
- Emails sent
- Unique emails opened
- Unique clicks on email links
- Emails soft bounce
- Emails hard bounce
- Email complaints

Dashboards
Anchor link toTo analyze the performance of your email campaigns in detail, use pre-built Emails and Application dashboards in the Statistics > Dashboards tab or create your custom dashboard for deeper analysis.
Email dashboard
Anchor link toThe Email dashboard provides you with an in-depth analysis of your email campaign performance. It displays various metrics such as the number of subscribers, email sends, opens, deliveries, and more.
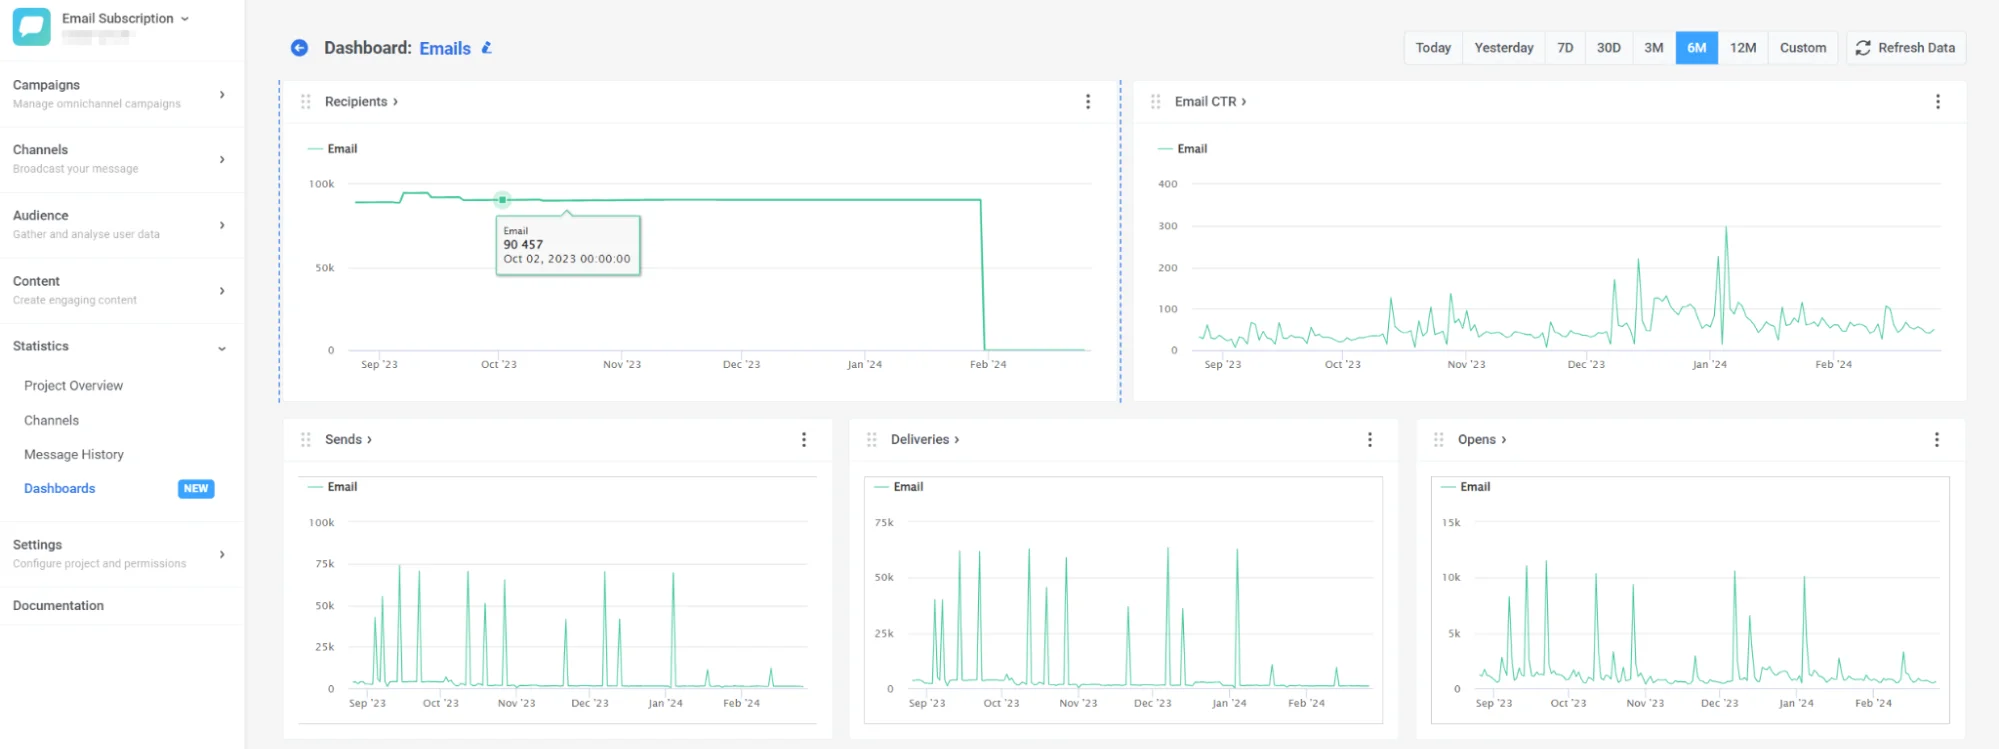
Also, you can customize the dashboard to fit your needs by adding or removing specific metrics, or create a custom dashboard entirely tailored to your campaigns. Learn how to do this here
Application dashboard
Anchor link toThe dashboard enables you to compare your email performance with other channels, providing insights into metrics such as recipients, subscribers, daily and monthly active users, etc., broken down by channel. Learn more