Analyze control group impact
Each control group’s page shows how your messaging performs against that group. Open it from Settings > Control groups by clicking the group’s row.
Terms used on this page:
- Control group: a fixed share of your users who don’t receive your marketing messages. See Understanding control groups.
- Treatment group: the rest of the group’s audience, who keep receiving your marketing messages as usual.
- Cycle: a period of measurement during which the group’s members stay the same. A new cycle starts after any of the changes listed in Compare events.
- Reachable users: users your campaigns can actually reach on at least one channel of your app. See What makes a user reachable.
Check the group’s mode and dates
Anchor link toBelow the group’s name, Measured among shows which users the cycle counts. See Which users are included in the comparison. If a Permanent group’s cycle counts all users, a banner above Measured among offers to start a new cycle for reachable users.
Under Measured among, the page shows the Group size, the Mode, the number of the current Cycle, and a date that depends on the mode:
| Mode | Date below the name | Label of the date-range selector |
|---|---|---|
| Permanent | Running since: the date the group started | No label |
| Auto-refresh | Range of the current cycle | Current cycle |
| Experiment with an end date | Range of the current cycle | Current experiment |
To see the results of an earlier cycle, open the date-range selector and pick it under Previous. Ended cycles are listed there by number, as Cycle or Experiment. A Permanent group can have earlier cycles too, because any of the changes listed in Compare events starts a new one.
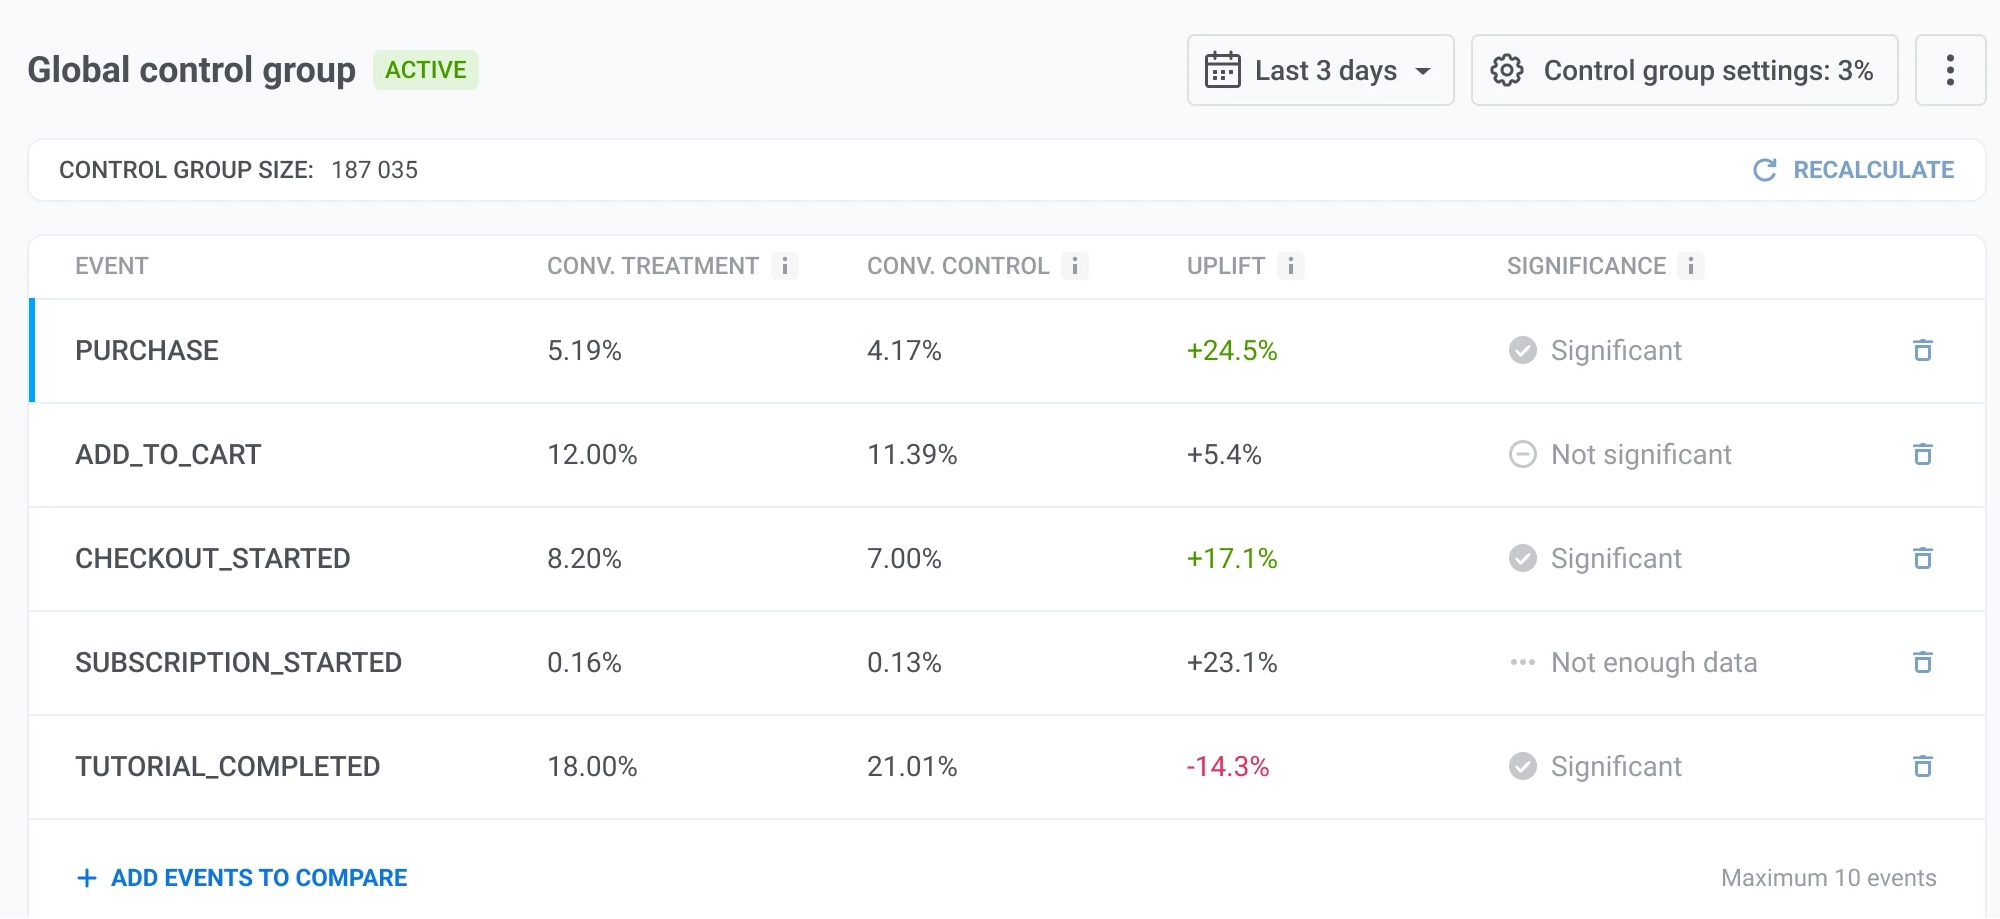
What the page compares
Anchor link toThe page compares the treatment group with the control group on any event you choose, for example a purchase. For each event, it shows how many users in each group did it. Control group users don’t receive your marketing messages, so any difference in their behavior isn’t influenced by your campaigns.
The comparison appears in two places: an events comparison table at the top and an Impact report below it.
Which users are compared depends on the group’s countries and tags, and on whether the cycle counts everyone or only the reachable users. See Which users are included in the comparison.
The current cycle’s data updates once a day. When a cycle ends, its final results usually appear under Previous within 15 minutes.
Compare events
Anchor link to-
Select a time window: Last 3 days, Last 7 days, or Last 30 days. To compare an earlier cycle, pick it under Previous.
The measurement window restarts, and earlier data is no longer included, when:
- you resize the group or change its countries;
- you change the group’s tag scope;
- you reshuffle the group;
- you change the mode;
- you disable the group and enable it again;
- an Auto-refresh cycle ends;
- an Experiment reaches its end date, which also turns the group off;
- you start a new cycle for reachable users.
Data from before that point no longer matches the current members or audience. Ended cycles are listed under Previous in the date-range selector.
-
Review the events comparison table. It only shows events automatically if you’ve set Conversion Goals in Customer Journey. Otherwise, the table starts empty.
-
Click Add events to compare to add any event you want to measure. You can add up to 10 events in total.
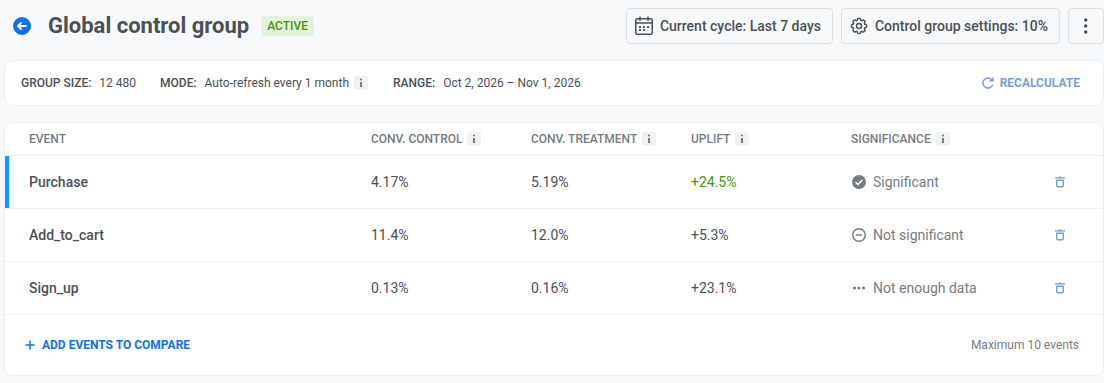
The table shows these metrics for each event:
| Metric | What it shows |
|---|---|
| Conv. Control | The share of unique users held out from marketing messages who triggered the event at least once anyway, without any messaging influence. |
| Conv. Treatment | The share of unique users in the treatment group who triggered the event at least once. The treatment group counts everyone in the measured audience outside the control group, whether or not a message actually reached them during the window. In a cycle measured among reachable users, the measured audience is the reachable users only. |
| Uplift | The percentage difference between the treatment and control conversion rates, relative to the control rate. A positive value means the treatment group converted better. Calculated as (conv. treatment − conv. control) / conv. control × 100%. |
| Significance | Whether the difference is statistically reliable. See the statuses in the next table. |
| Significance status | What it means |
|---|---|
| Significant | The uplift is unlikely to be due to chance. Pushwoosh marks it this way when a two-sided z-test of the two conversion rates gives a P-value below 0.05, which is a Confidence above 95%. |
| Not significant | The difference isn’t statistically reliable yet. |
| Not enough data | Either group has fewer than 10 conversions or fewer than 10 non-conversions for this event, so significance can’t be calculated. |
View the Impact report
Anchor link toUse the View event dropdown to select an event from the table. The Impact report below shows a deeper breakdown for that event.
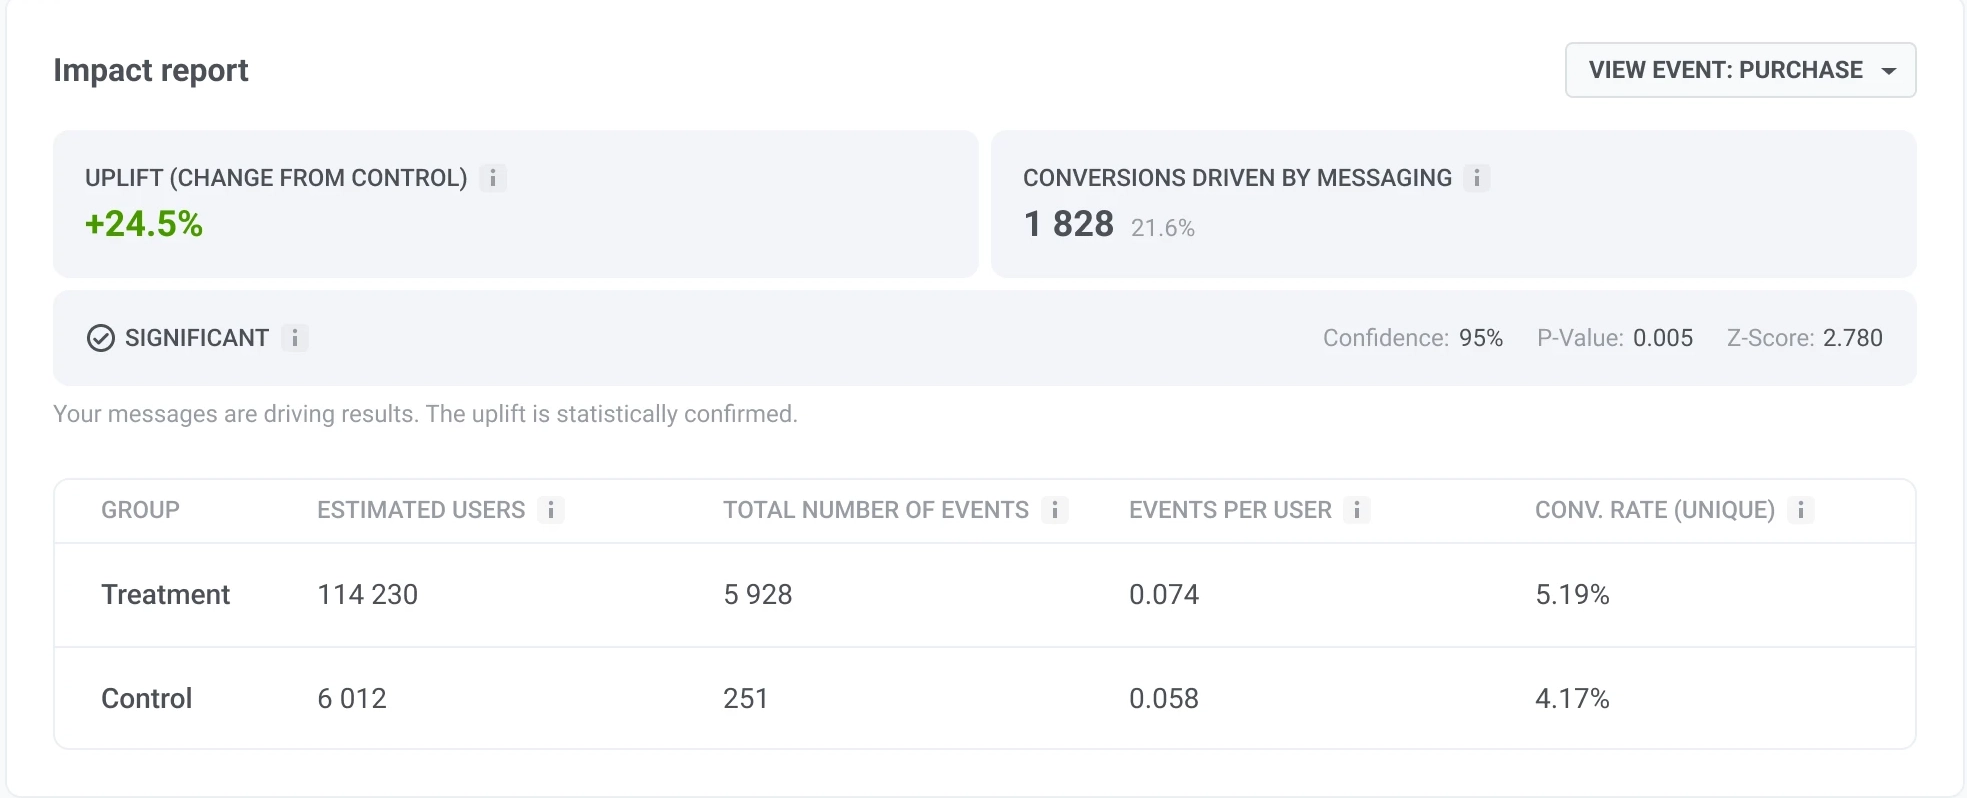
| Metric | What it shows |
|---|---|
| Uplift (change from control) | How much the treatment conversion rate differs from the control conversion rate. The same value as in the events table. |
| Conversions driven by messaging | The estimated number of extra events your messages generated beyond what’s expected without messaging. The percentage shows them as a share of all treatment events. Calculated as (events per user in treatment − events per user in control) × treatment group size. |
| Significance | Whether the difference is statistically reliable: Significant, Not significant, or Not enough data. Based on Confidence and P-value. |
| Confidence | How sure Pushwoosh is that the uplift reflects a real difference rather than chance, as a percentage. The higher it is, the stronger the evidence. |
| P-value | How likely this difference would appear by chance if messaging had no real effect. The lower it is, the stronger the evidence. |
| Z-score | How far apart the two groups performed. Close to 0, the difference could be random. The further from 0, the more confident you can be that one group is better. |
| Group breakdown | Treatment and Control side by side: Estimated users (Reachable users for a cycle measured among reachable users), Total number of events, Events per user, and Conv. rate (unique). |
How to read the results
Anchor link to- Significant, positive Uplift: your messaging is driving this event. Keep sending it.
- Significant, negative Uplift: the control group converts better than the treatment group on this event. Before concluding messaging is working against you, check whether this event is one messaging is actually meant to drive.
- Not significant: the difference isn’t reliable yet, not that there’s no effect. Let the event accumulate more conversions before judging it.
- Not enough data: either group has fewer than 10 conversions or fewer than 10 non-conversions for this event. Compare an event with more volume, or wait for more of it to happen.
Two more things to keep in mind:
- Compare within one measurement window. Reshuffling, resizing, rescoping, changing the mode, turning the group off and on, an Auto-refresh rollover, an Experiment end, or a new cycle for reachable users restarts the window. Results from before and after one of these aren’t comparable, and neither are a cycle measured among all users and one measured among reachable users.
- Pick events your campaigns are meant to drive, such as a purchase or a sign-up, rather than events messaging has no direct path to.
Which users are included in the comparison
Anchor link toThe page analyzes one cycle at a time. Each cycle counts either all users of the audience or only the reachable ones. The group’s page shows which one under Measured among:
| Label | What the cycle counts |
|---|---|
| Reachable users · N (X%) | Only users your campaigns could reach when the cycle started. N is the number of users measured in both groups, and X% is their share of the whole audience. |
| All users | Every user of the audience, including those your campaigns can’t reach. Older cycles of existing groups show this label and keep their numbers. So does the running cycle of a Permanent group until you start a new cycle. |
A new group’s first cycle and every cycle that starts after one of the changes listed in Compare events are measured among reachable users.
In the date-range selector, each cycle under Previous shows which users it was measured among.
Counting only reachable users gives a more precise picture of what your messaging does:
- Users your campaigns can’t reach can’t respond to your messages, and counting them makes the messaging look less effective. A cycle measured among reachable users leaves them out.
- Both groups are counted the same way, so the comparison stays fair. Control group users count if a campaign could reach them, even though they don’t receive marketing messages.
- Expect higher conversion rates than in cycles measured among all users. Those cycles also count users your campaigns can’t reach.
What makes a user reachable
Anchor link toA user is reachable if they can receive messages on at least one channel your app uses. For push, one device is enough. The conditions for each channel:
| Channel | Reachable if |
|---|---|
| Push | The device has a push token, and notifications are turned on. For web push, a push token is enough. |
| The user has an email address that isn’t unsubscribed and hasn’t bounced. | |
| SMS | The user has a phone number for SMS and hasn’t opted out of marketing SMS. If your app requires opt-in consent for SMS, the user must have given it. |
| The user has a WhatsApp number. | |
| In-app | The user opened the app in the 30 days before the cycle started. |
Only the channels your app actually uses count:
- A channel counts only if your app sent messages through it in the 30 days before the cycle started.
- Other channels, such as Viber or App Inbox, don’t make a user reachable.
For example, if your app only sends push notifications, a user with an email address but no push token isn’t reachable.
In a cycle measured among reachable users, reachability and the group’s audience are taken at the start of the cycle and don’t change until it ends. A user who uninstalls the app, turns off notifications, or gets a different tag value later in the cycle stays in the count.
A cycle measured among all users works differently: it counts the users who match the group’s countries and tag values today, so a user whose tag value changes drops out of the count.
Reachability doesn’t change who is in the control group. Users with no reachable channel are still held out from marketing messages.
- Group size at the top of the page counts all members of the control group.
- The Impact report counts only the reachable ones, so the control group’s Reachable users can be smaller than Group size.
Start a new cycle for reachable users
Anchor link toA Permanent group never ends its cycle on its own, so its running cycle stays measured among all users until you start a new one. The page then shows A more precise method is available above Measured among.
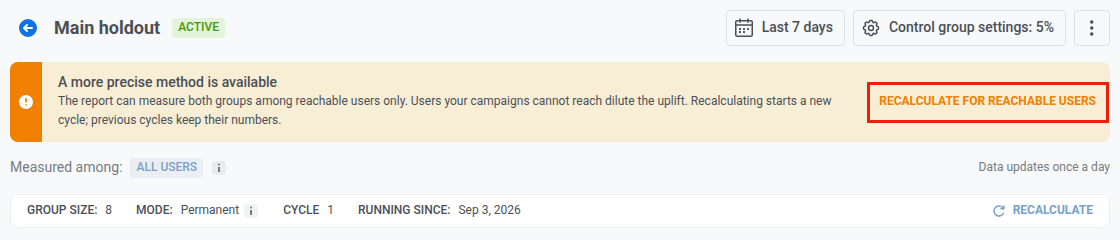
To start a new cycle measured among reachable users:
-
Click Recalculate for reachable users.
-
In the confirmation dialog, click Start new cycle.
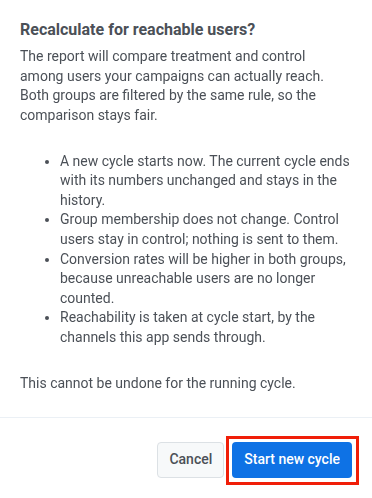
Starting a new cycle does this:
- The current cycle ends with its numbers unchanged and stays under Previous.
- A new cycle starts now, measured among reachable users.
- The group’s members don’t change: control group users stay in the control group and still don’t receive marketing messages.
You can’t undo this for the running cycle. The first numbers of the new cycle appear within a day.
Auto-refresh and Experiment groups don’t show this option. An Auto-refresh group’s next cycle is measured among reachable users automatically. An Experiment turns off when it ends, and the cycle that starts when you enable it again is measured among reachable users.