App Inbox statistics
App Inbox statistics show how many people actually got the message, how many opened it, and how many tapped it, plus where you lose the rest along the way.
Open App Inbox statistics
Anchor link to- Double-click the App Inbox element on a journey canvas.
- Check the panel’s metrics for this element. See Metrics on the canvas below.
- Click Detail statistics to open the full Message stats page, with Overview, Timeline, and Errors tabs.
Metrics on the canvas
Anchor link toDouble-click the App Inbox element on a journey canvas to open this panel. It counts people, not messages, giving you a quick read on delivery and engagement before you open Detailed statistics below.
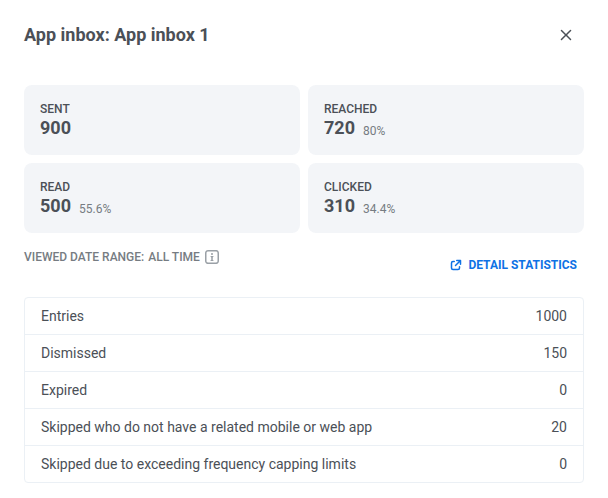
| Metric | What it means |
|---|---|
| Entries | Everyone this element tried to reach. |
| Sent | People who got the message in their inbox. |
| Reached | People who have the message in their inbox. It appears when they open the app, even if they haven’t looked at it yet. |
| Read | People who opened and looked at the message. |
| Clicked | People who tapped the message. |
| Dismissed | People who deleted the message, whether or not they’d read it first. |
| Expired | People whose message disappeared before they read it. A high number means people need more time. Try a longer expiration. |
| Skipped (no app) | People with no mobile or web app set up to show an inbox, so the message had nowhere to go. |
| Frequency capping skipped | People who’d already hit their App Inbox limit, so this message wasn’t delivered. |
Detailed statistics
Anchor link toUse Message stats to check how this App Inbox element performed, from audience to clicks.
Overview tab
Anchor link toUse the Overview tab to check delivery and engagement for this element.
Campaign performance
Anchor link toThese cards summarize how this App Inbox element performed.
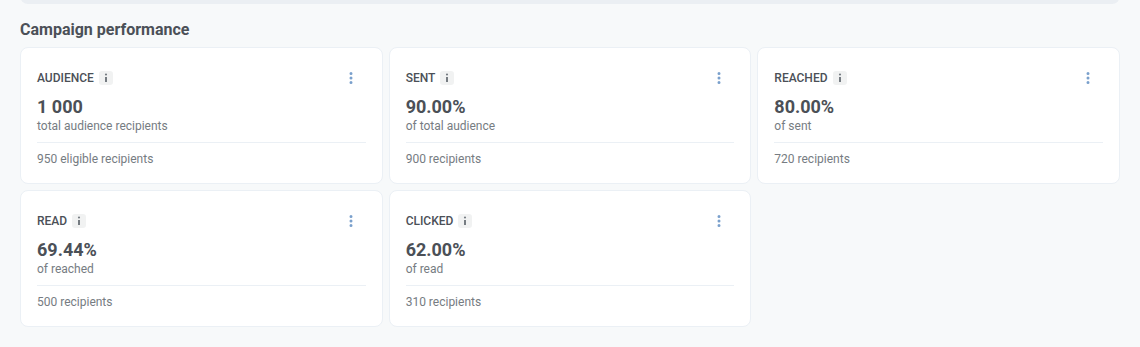
| Card | What it shows | Formula |
|---|---|---|
| Audience | Total audience users for this element, and how many stayed eligible after exclusions (frequency capping or a control group). | Eligible users + excluded users |
| Sent | Share of total audience who got the message in their inbox. | Placed into inboxes ÷ total audience |
| Reached | Share of sent users whose app picked up the message at least once. It’s on their device, but they may not have looked at it yet. | Reached ÷ sent |
| Read | Share of reached users who opened the message, whether or not they later deleted it. | Read ÷ reached |
| Clicked | Share of read users who tapped the message. Repeat taps count once. | Clicked ÷ read |
Campaigns distribution
Anchor link toCampaigns distribution shows how users move through the funnel. Switch between Funnel view and Table view with the dropdown in the block header.
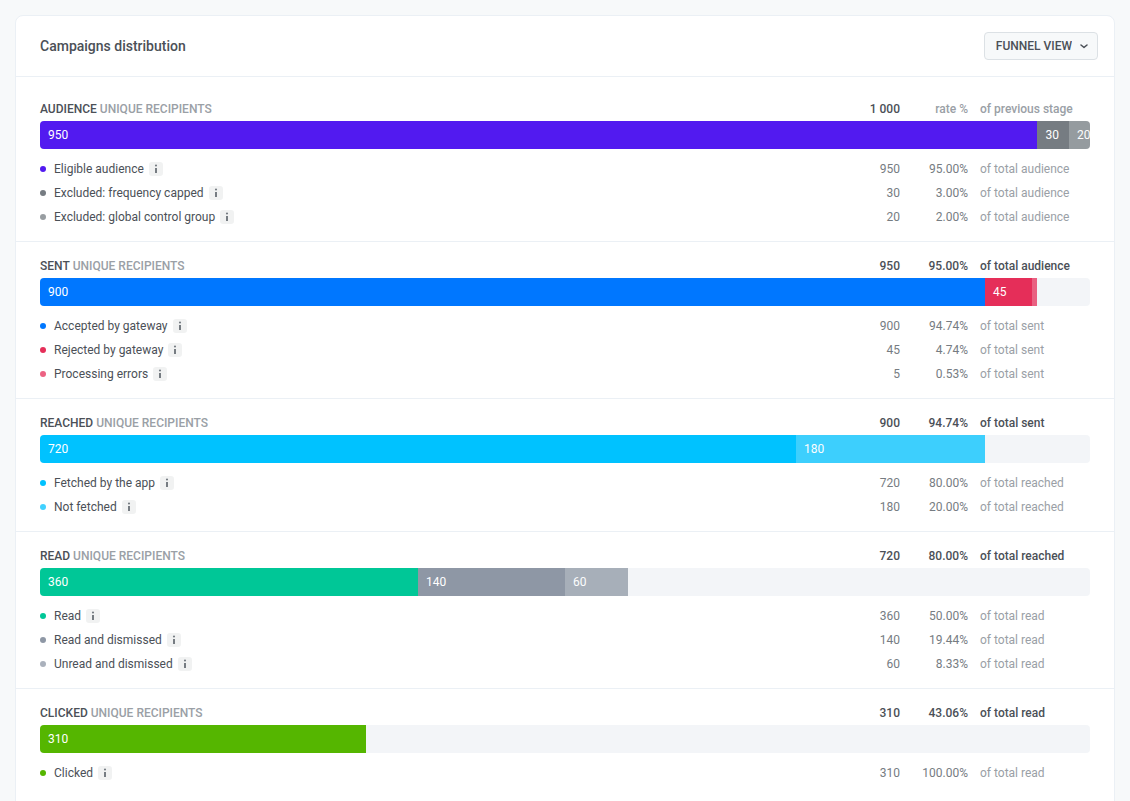
Each row shows how many people reached that stage, and why some didn’t move to the next one:
| Stage | What it means |
|---|---|
| Audience | Everyone this element targeted. Some are excluded before anything sends: they already hit their frequency capping limit, or they’re in a global control group. |
| Sent | Almost everyone eligible gets the message in their inbox. A few don’t, usually a bad device or token, or a delivery error. Check the Errors tab for the reason. |
| Reached | Most sent messages get picked up the moment the user opens the app. The rest are just waiting: their app hasn’t fetched the message yet, which isn’t a delivery failure. |
| Read | Most reached messages get opened. Some people delete a message without reading it, and some read it and then delete it. Either way, once it’s deleted it won’t count as unread. |
| Clicked | Some people who read the message go on to tap it. Repeat taps count once, the same way Read counts repeat opens once. |
Timeline tab
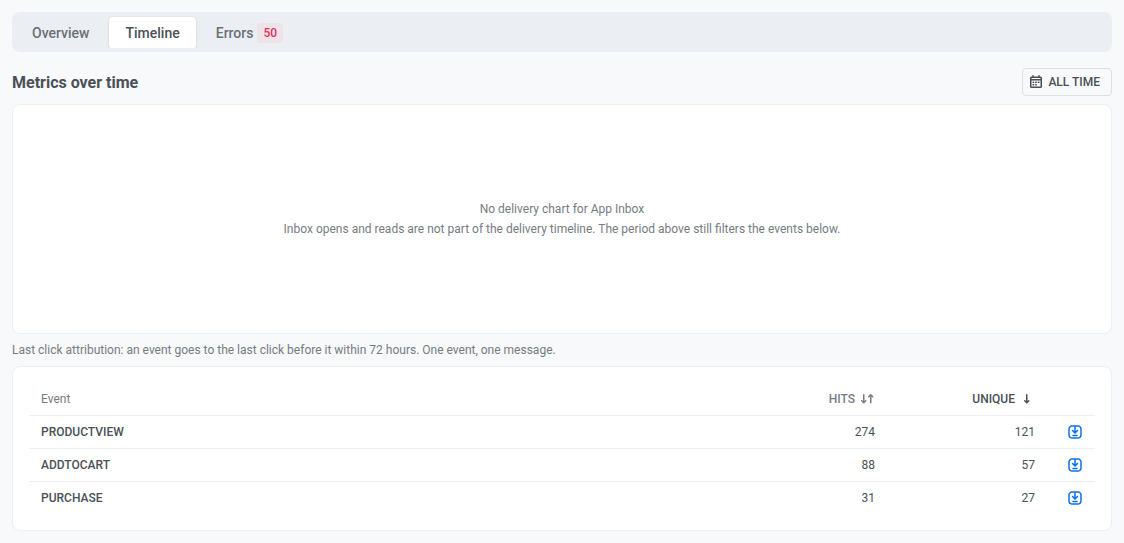
Anchor link toUse the Timeline tab to check the custom events that followed this message. App Inbox has no delivery chart, so the tab shows No delivery chart for App Inbox in its place and the Events table under it. Set the period at the top of the tab to choose which events the table counts.
Custom events after opening this message
Anchor link toThe Events table shows the custom events your app sent after users opened this message in the inbox. It fills in only if your app sends events to Pushwoosh.
Each event goes to the message the user last clicked within the 72 hours before the event:
- What counts as a click: Opening the message.
- Clicks on other messages: Clicks on all messages of the same app count, so an event that follows a click on a later message goes to that later message, not to this one.
- Limits: One event goes to one message only.
| Column | What it shows |
|---|---|
| Event | The event name. |
| Hits | How many events went to this message. Every event the user sends after opening it counts, until the user clicks another message or 72 hours pass. |
| Unique | How many distinct users sent the event at least once. |
Events are matched to the message by User ID, not by device.
The period filters the events, not the opens. An open before the start of the period still counts for an event inside the period. Each row has an export icon that downloads the devices behind that row as CSV, counted by the same rule.
Errors tab
Anchor link toErrors lists every delivery error for this element, grouped by platform, with the sender’s own error name and share of that platform’s sends.
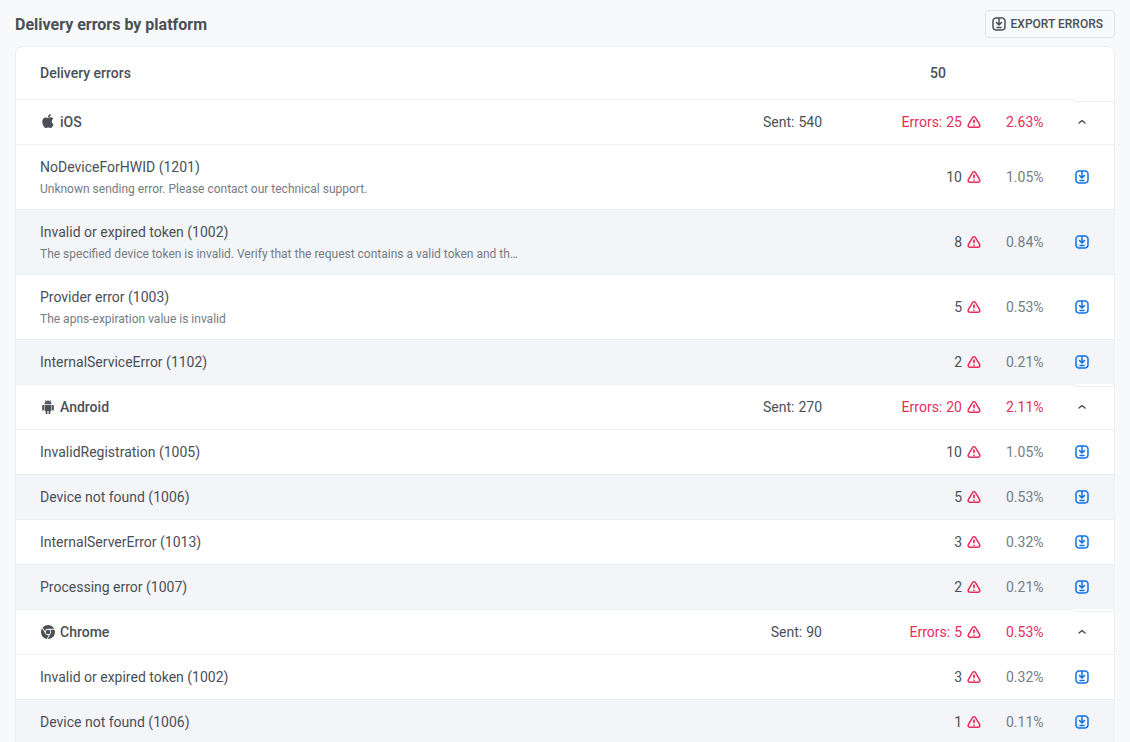
Click Export errors to download the full list. Exporting errors requires the Personal data permission in your role.