Aggregated messages
The Aggregated messages (campaigns) section provides performance statistics for communications grouped into campaigns. This helps you monitor how your messages perform over time and analyze the performance of your messaging strategy.
You can add one-time push notifications or emails to a campaign yourself, from their own send flow. Once messages are in, their total performance is tracked in one campaign view.
Create a campaign
Anchor link to-
Go to Statistics → Aggregated messages.
-
Click Create.
-
Enter a name and description for your campaign.
-
Click Apply to save your changes.
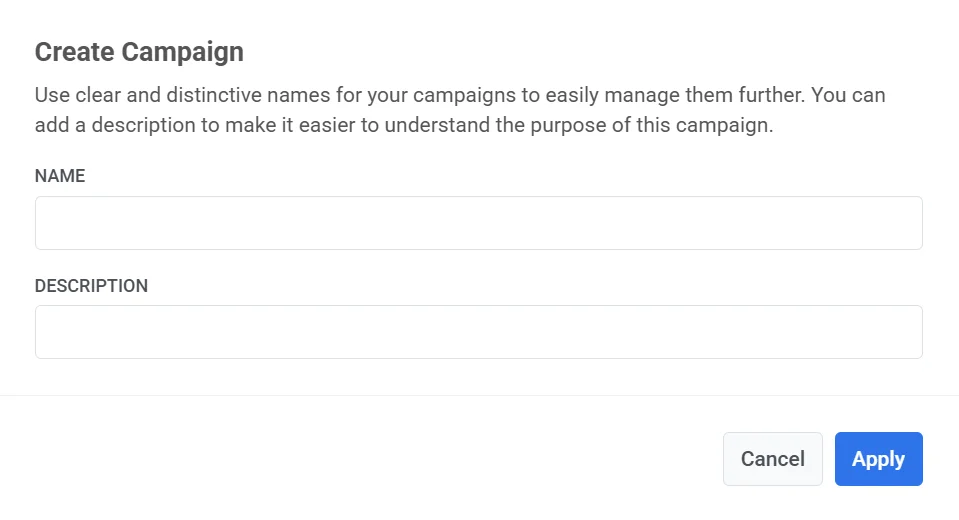
After the campaign is created, you can assign one-time emails or push notifications to it.
Pushwoosh will automatically track and display the combined performance of all assigned messages in Message stats.
View and manage campaigns
Anchor link toOn Statistics → Aggregated messages, the list shows each campaign’s Campaign name and Description. Use Search to find a campaign by name.
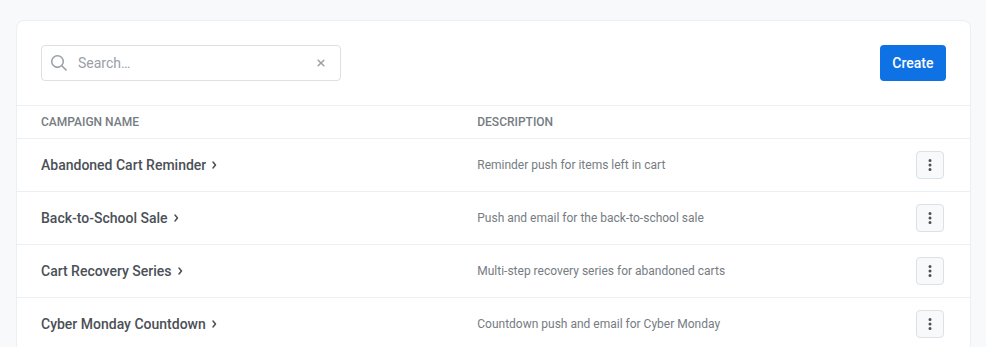
To manage a campaign, click the three-dot menu (⋮) next to the campaign name, then choose:
- Open: View detailed performance metrics and all associated messages.
- Messages Log: Access a full list of communications included in the campaign.
- Edit: Update the campaign’s name or description.
- Delete: Remove the campaign from your dashboard.
Message stats
Anchor link toTo open Message stats for a campaign, click its name in the Aggregated messages list.
The dashboard always shows Overview, Errors, and Timeline. Events (push) or Clicks (email) appear only after the campaign has sent something on that channel.
Overview tab
Anchor link toUse the Overview tab to check lifetime reach, opens, and where recipients dropped off. On email, you also see delivery, clicks, and unsubscribes.
Campaign performance
Anchor link toThese cards summarize how the campaign performed for the channel you are viewing. Hover the i icon on any card for the exact percentage formula.
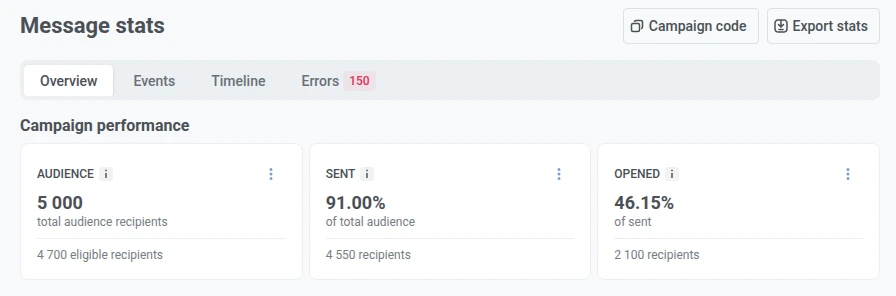
| Card | What it shows |
|---|---|
| Audience | Who you targeted for this campaign, and how many stayed eligible after exclusions. |
| Sent | Share of Audience that the delivery side accepted for sending. |
| Opened | Share of Sent on push, or of Delivered on email, that opened at least once. |
| Delivered | Email only. Share of Sent that did not bounce. |
| Clicked | Email only. The same total the Clicks tab breaks down link by link. |
| Unsubscribed | Email only. Share of delivered recipients who unsubscribed or marked the message as spam. |
Once a card has recipients, use its three-dot menu (⋮) to Export list or Create segment. Details are in Export recipients and create a segment.
Campaigns distribution
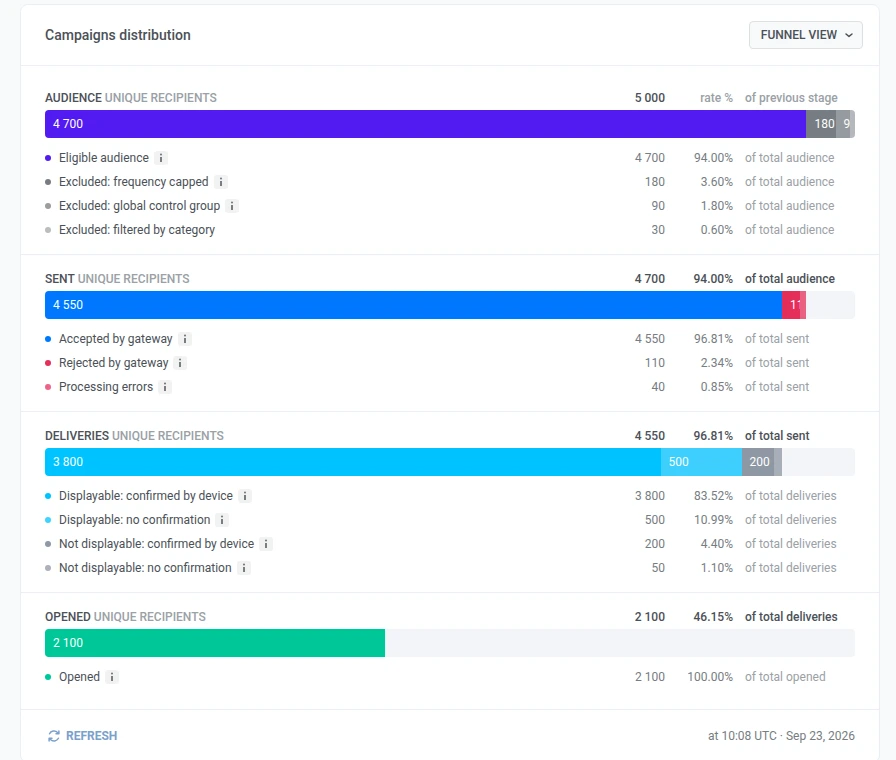
Anchor link toCampaigns distribution shows the same lifetime numbers as the cards, broken into four steps:
- Audience: who you targeted
- Sent: who was accepted for sending
- Deliveries: who got a delivery confirmation
- Opened: who opened
- Open the view dropdown in the section’s top-right corner.
- Choose Funnel view (default) or Table view.
How to read the funnel
Anchor link to- The percentage on a step is the share that reached it from the step above.
- The list under a step shows how those recipients split (for example accepted vs rejected).
- If a row is missing, nobody fell into that group for this campaign.
| Stage | What it shows |
|---|---|
| Audience | Who you targeted, then who was left out. Any channel:
|
| Sent | Whether the message was taken for delivery or not.
|
| Deliveries | Push only. Whether alerts were on at send time, and whether the device confirmed delivery. Note: A silent push that confirms still counts as a delivery. |
| Opened |
|
Events tab
Anchor link toThe Events tab only appears for a campaign’s push channel. Use it to see how often custom app events fired after the campaign’s pushes went out, beyond opens tracked automatically.
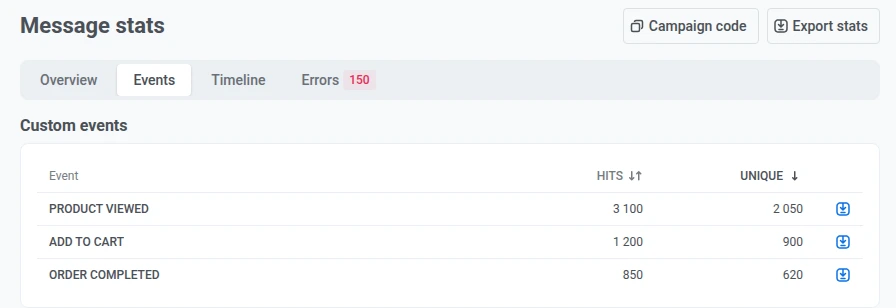
| Column | What it shows |
|---|---|
| Hits | How many times the event fired. |
| Unique | How many unique users triggered it at least once. This is an estimate, not an exact recount, so don’t expect it to match an export row for row. |
Click the download icon next to an event to export it.
Clicks tab
Anchor link toThe Clicks tab only appears for a campaign’s email channel. It lists every link in the campaign’s emails with its click count, sortable by clicks.
- To highlight a link on the click map, select its row in the list.
- If a link has extra tracking parameters, expand the row to see clicks by parameter value.
- To export who clicked a link, use the download icon next to it.
Click map
Anchor link toUse the click map next to the link list to see where people clicked in the email. Darker links got a larger share of the clicks. On a campaign, the map pools clicks from every message in the campaign onto that one preview.
Timeline tab
Anchor link toUse the Timeline tab to see how the campaign performed over a date range, not only as lifetime totals on Overview.
The chart and the table under it track the same four metrics:
- Accepted by gateway: the delivery platform (Apple, Google, or another) took the push into work. On email, this is Accepted by sender service: the provider took the message into work.
- Rejected by gateway: the platform rejected the send (for example a token or configuration problem). On email: Rejected by sender service.
- Delivery confirmations: the device, platform, or mailbox provider reported delivery. This is not the same as the person seeing or opening the message.
- Opens: someone opened the push or email.
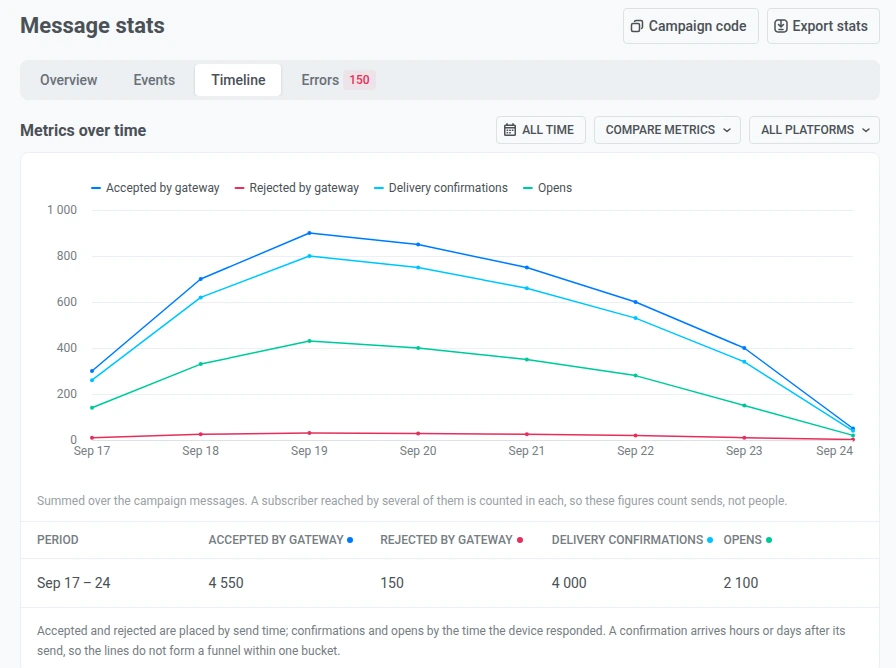
To configure the chart:
- Set the time range with All time or a preset window.
- Use Compare metrics to show a subset of the chart’s lines.
- Use All platforms to keep every platform, or pick one platform to filter the chart and table.
These controls apply only to the chart and the summary table. They do not change the Overview cards or funnel.
Errors tab
Anchor link toUse the Errors tab to review delivery failures under Delivery errors by platform.
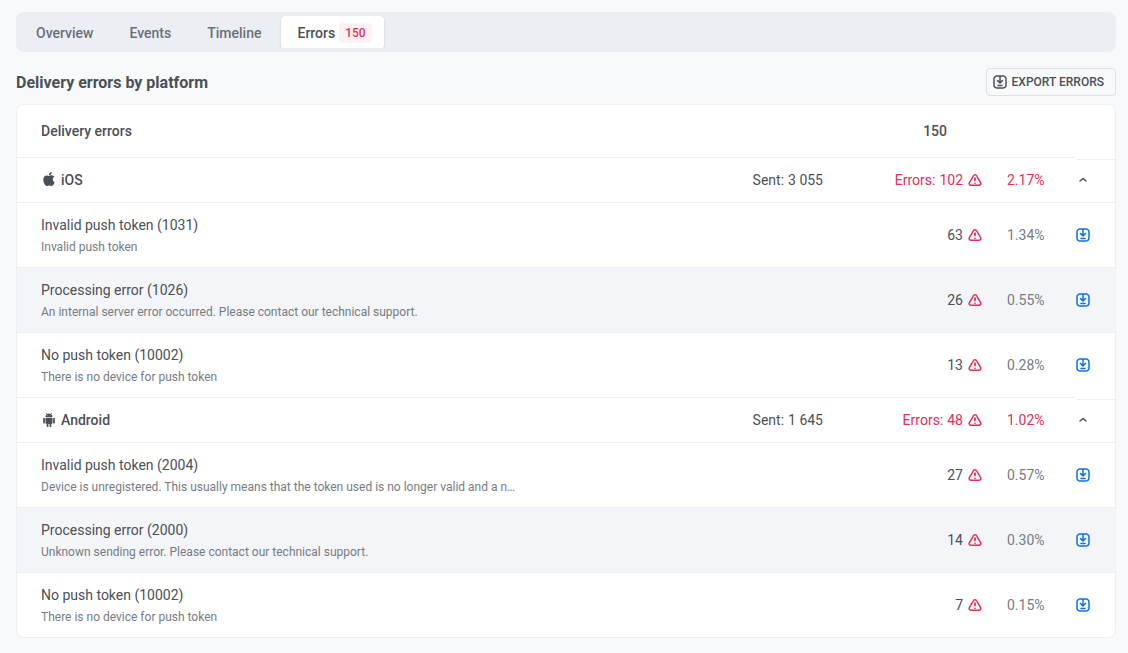
- Check each platform for how many messages were sent and how many errored (count and percentage).
- Expand a platform to see each error type (for example Invalid or expired token, Processing error, Provider quota exceeded) with its own count and percentage.
- To export recipients for one error, click the download icon next to that error.
- To export every error on the tab in one file, click Export errors.
Exporting errors requires the Personal data permission in your role.
Copy the campaign code
Anchor link toTo copy the campaign ID:
- At the top of the page, click Campaign code.
- The ID is copied to your clipboard.
Pass it as the campaign parameter in messages:list when you need the campaign’s messages from the API. You usually do not need it to read the stats.
Export recipients and create a segment
Anchor link toExport recipients
Anchor link toExporting recipients requires the Personal data permission in your role.
To download recipients as CSV from the top of the page:
- Click Export stats.
- Confirm the download.
You can also click Export list from a card’s three-dot menu (⋮) on Overview, or from an error row on the Errors tab.
Export stats, and Export list from those two places, use the same per-recipient log, windowed to the last 30 days: anyone older is missing from the download.
An event or link row on the Events or Clicks tab (download icon) exports separately, covering the campaign’s whole history, not just the last 30 days.
The export controls appear only after the campaign has sent at least one message.
Create a segment
Anchor link toYou can create a segment from Sent, Delivered, Opened, or Clicked on Overview.
- Open the three-dot menu (⋮) on that card.
- Click Create segment.
- Name the segment and save it.