# Overview Push tab Events graph
On your project's **Overview** page, switch to the **Push** tab to see an **Events** graph that visualizes push campaign activity over time. Use the graph's source filter to narrow the data down to a specific type of push campaign.
## Filter by message source
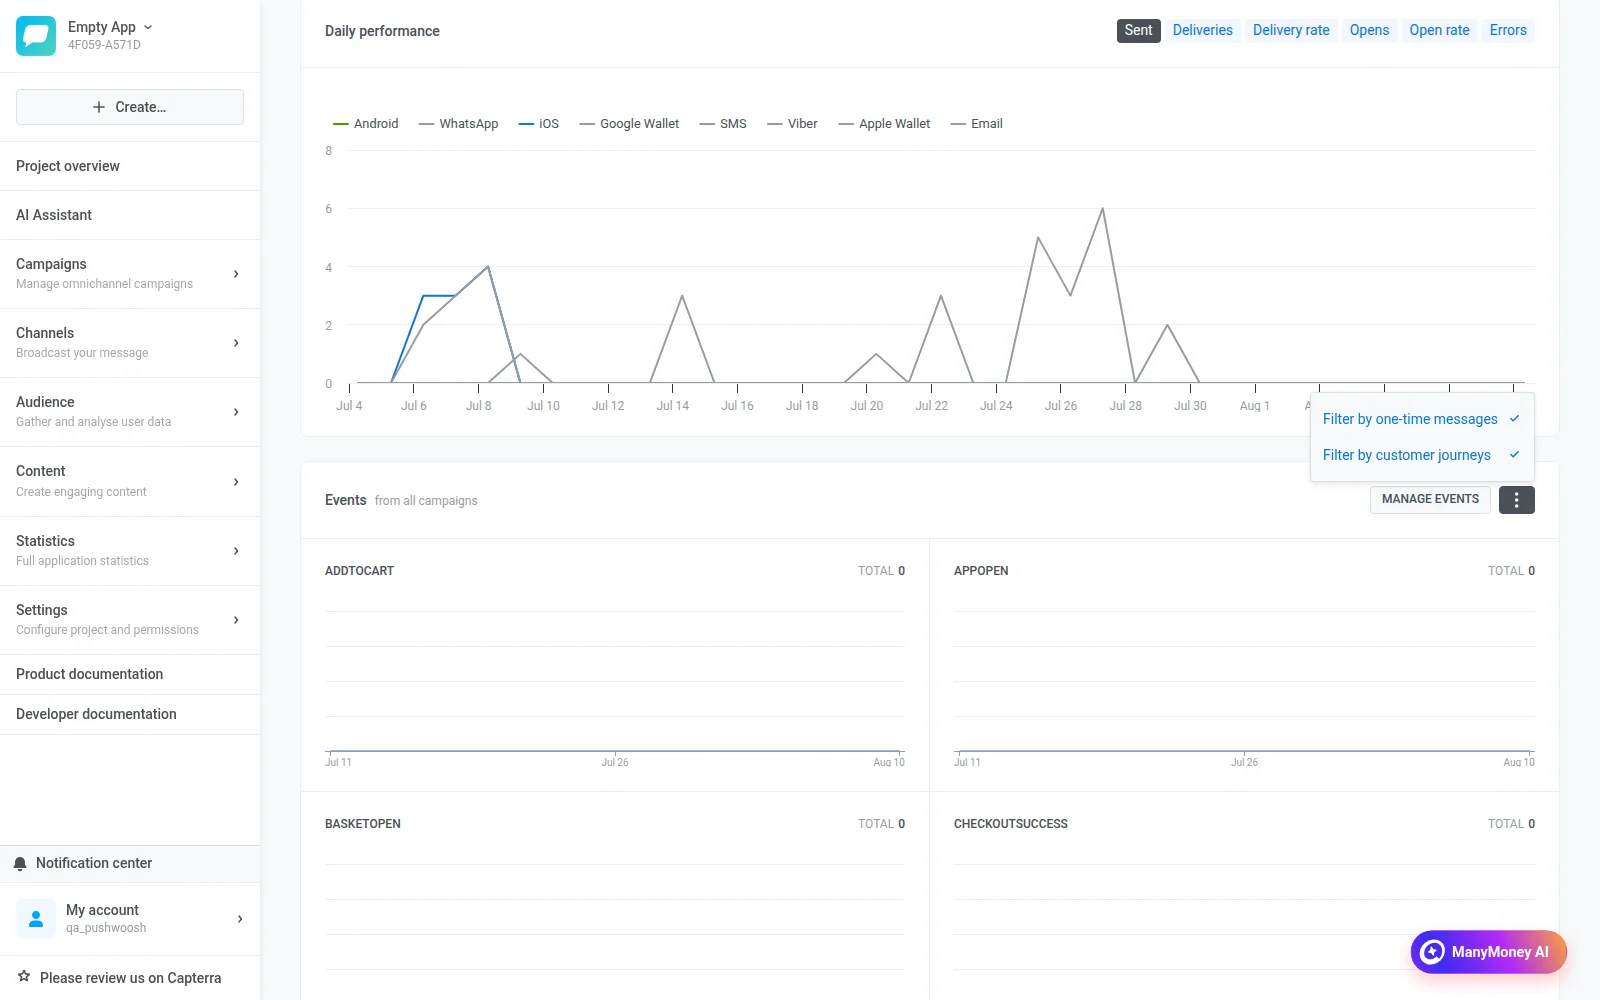
Click the **three-dot menu (⋮)** in the top-right corner of the Events graph to open the source filter. It lists two checkboxes:
* **Filter by one-time messages** — pushes sent as [one-time messages](/product/messaging-channels/push-notifications/send-push-notifications/one-time-push/), without a customer journey.
* **Filter by customer journeys** — pushes sent from a [customer journey](/product/customer-journey/pushwoosh-journey-overview/).
Selecting only one checkbox narrows the graph to campaigns from that source only. Clearing both checkboxes empties the graph, since no source is selected to pull data from.
 ## Filter by message source
Click the **three-dot menu (⋮)** in the top-right corner of the Events graph to open the source filter. It lists two checkboxes:
* **Filter by one-time messages** — pushes sent as [one-time messages](/product/messaging-channels/push-notifications/send-push-notifications/one-time-push/), without a customer journey.
* **Filter by customer journeys** — pushes sent from a [customer journey](/product/customer-journey/pushwoosh-journey-overview/).
Selecting only one checkbox narrows the graph to campaigns from that source only. Clearing both checkboxes empties the graph, since no source is selected to pull data from.
## Filter by message source
Click the **three-dot menu (⋮)** in the top-right corner of the Events graph to open the source filter. It lists two checkboxes:
* **Filter by one-time messages** — pushes sent as [one-time messages](/product/messaging-channels/push-notifications/send-push-notifications/one-time-push/), without a customer journey.
* **Filter by customer journeys** — pushes sent from a [customer journey](/product/customer-journey/pushwoosh-journey-overview/).
Selecting only one checkbox narrows the graph to campaigns from that source only. Clearing both checkboxes empties the graph, since no source is selected to pull data from.