# Project statistics
Glance over your marketing campaigns' performance with comprehensive stats for each of your projects! On the Project Overview page, you'll get the most up-to-date statistics right at your fingertips, containing the essential metrics on your project's audience and engagement levels.
## General Info
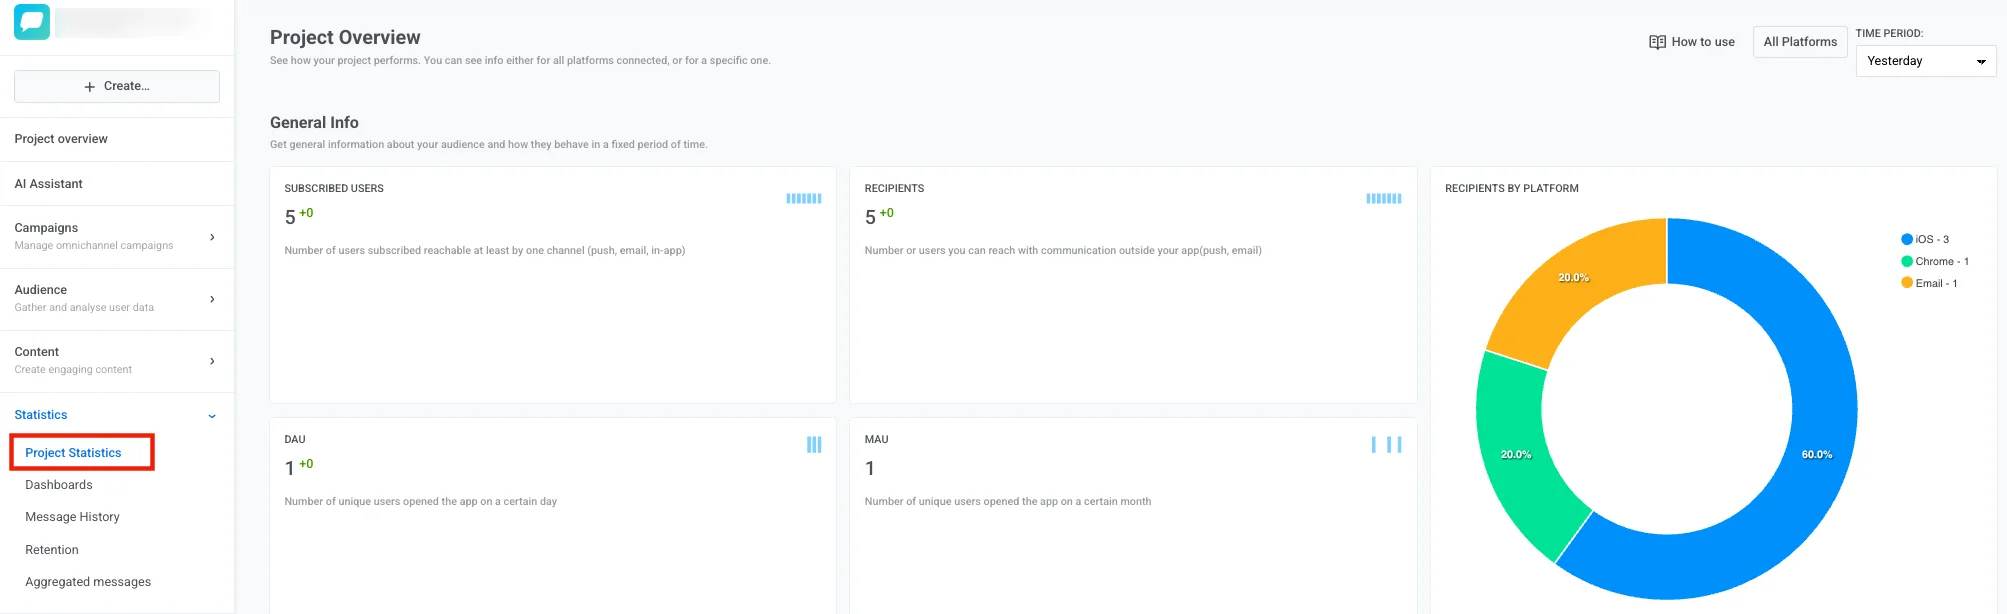
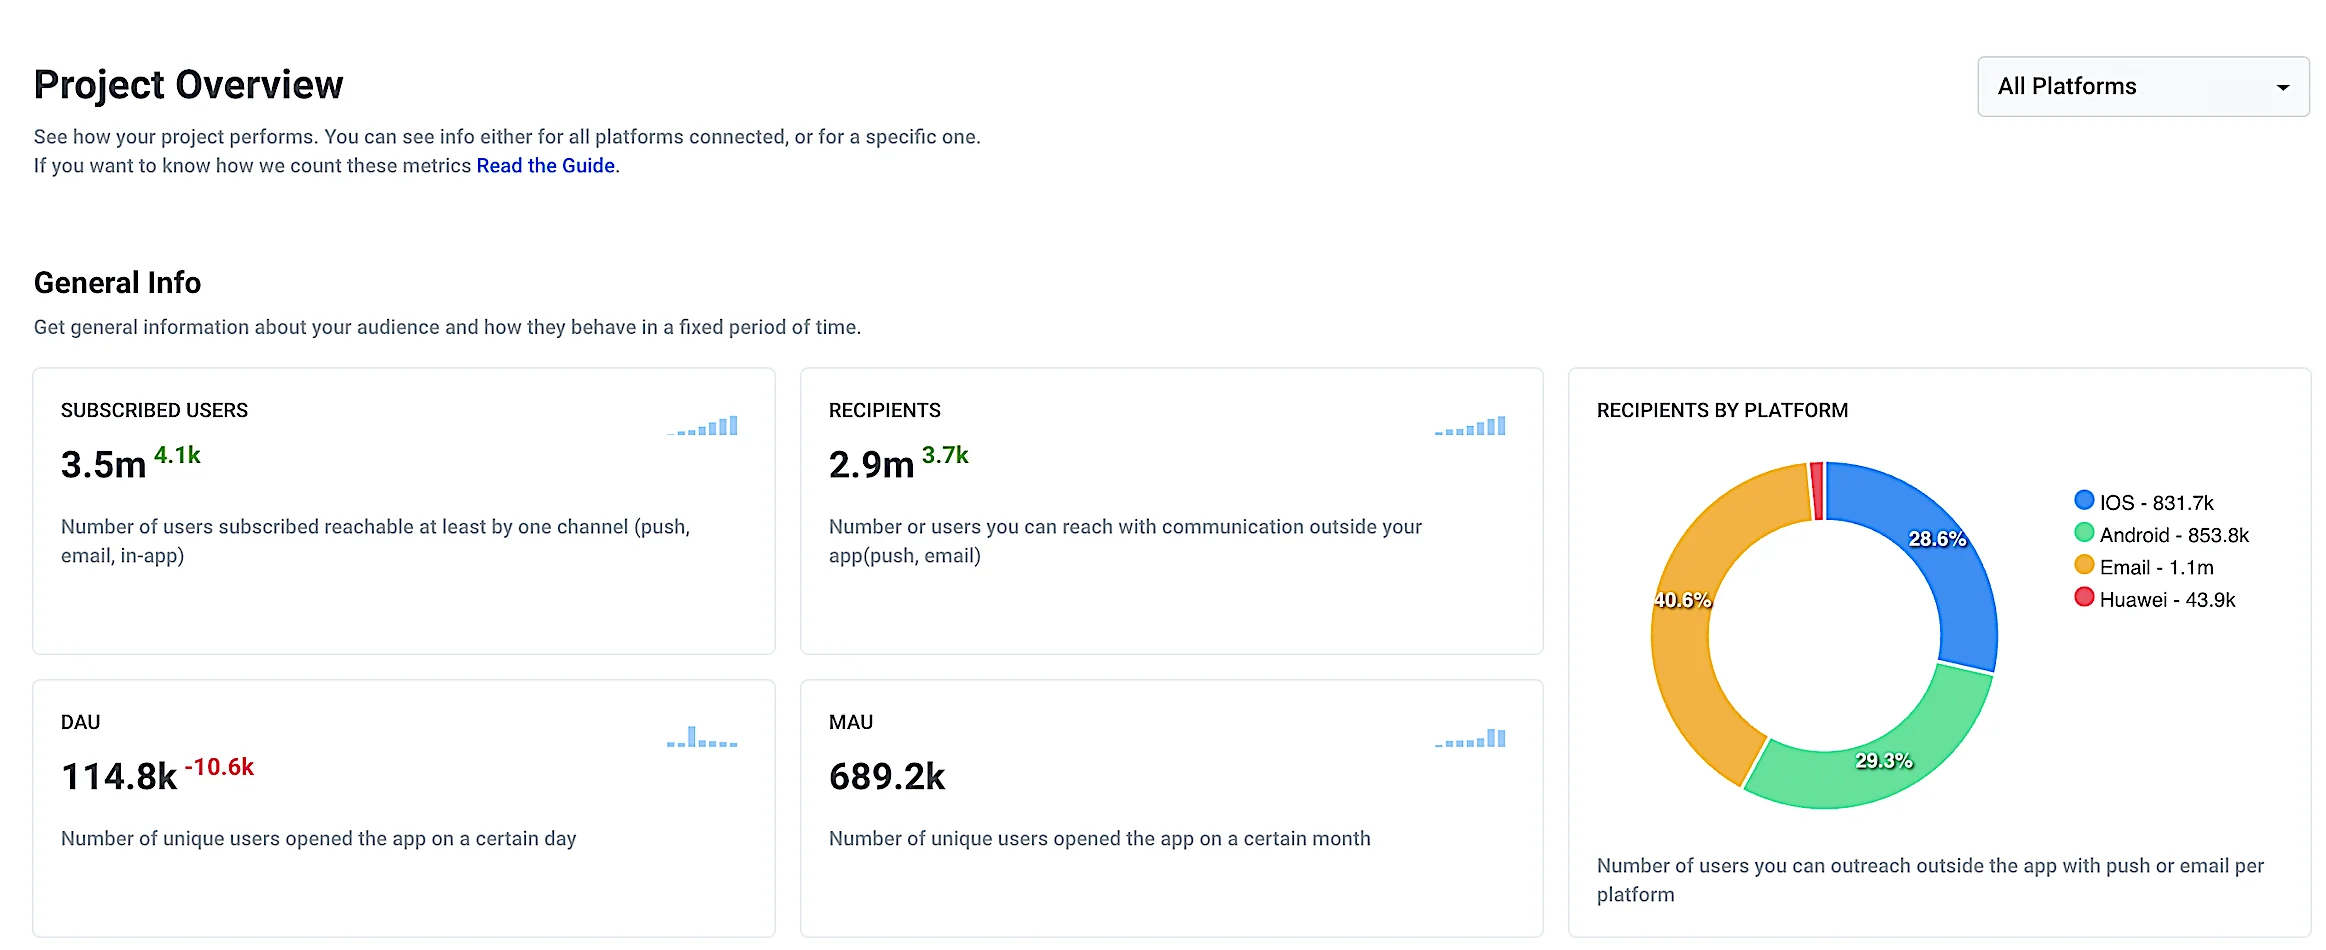
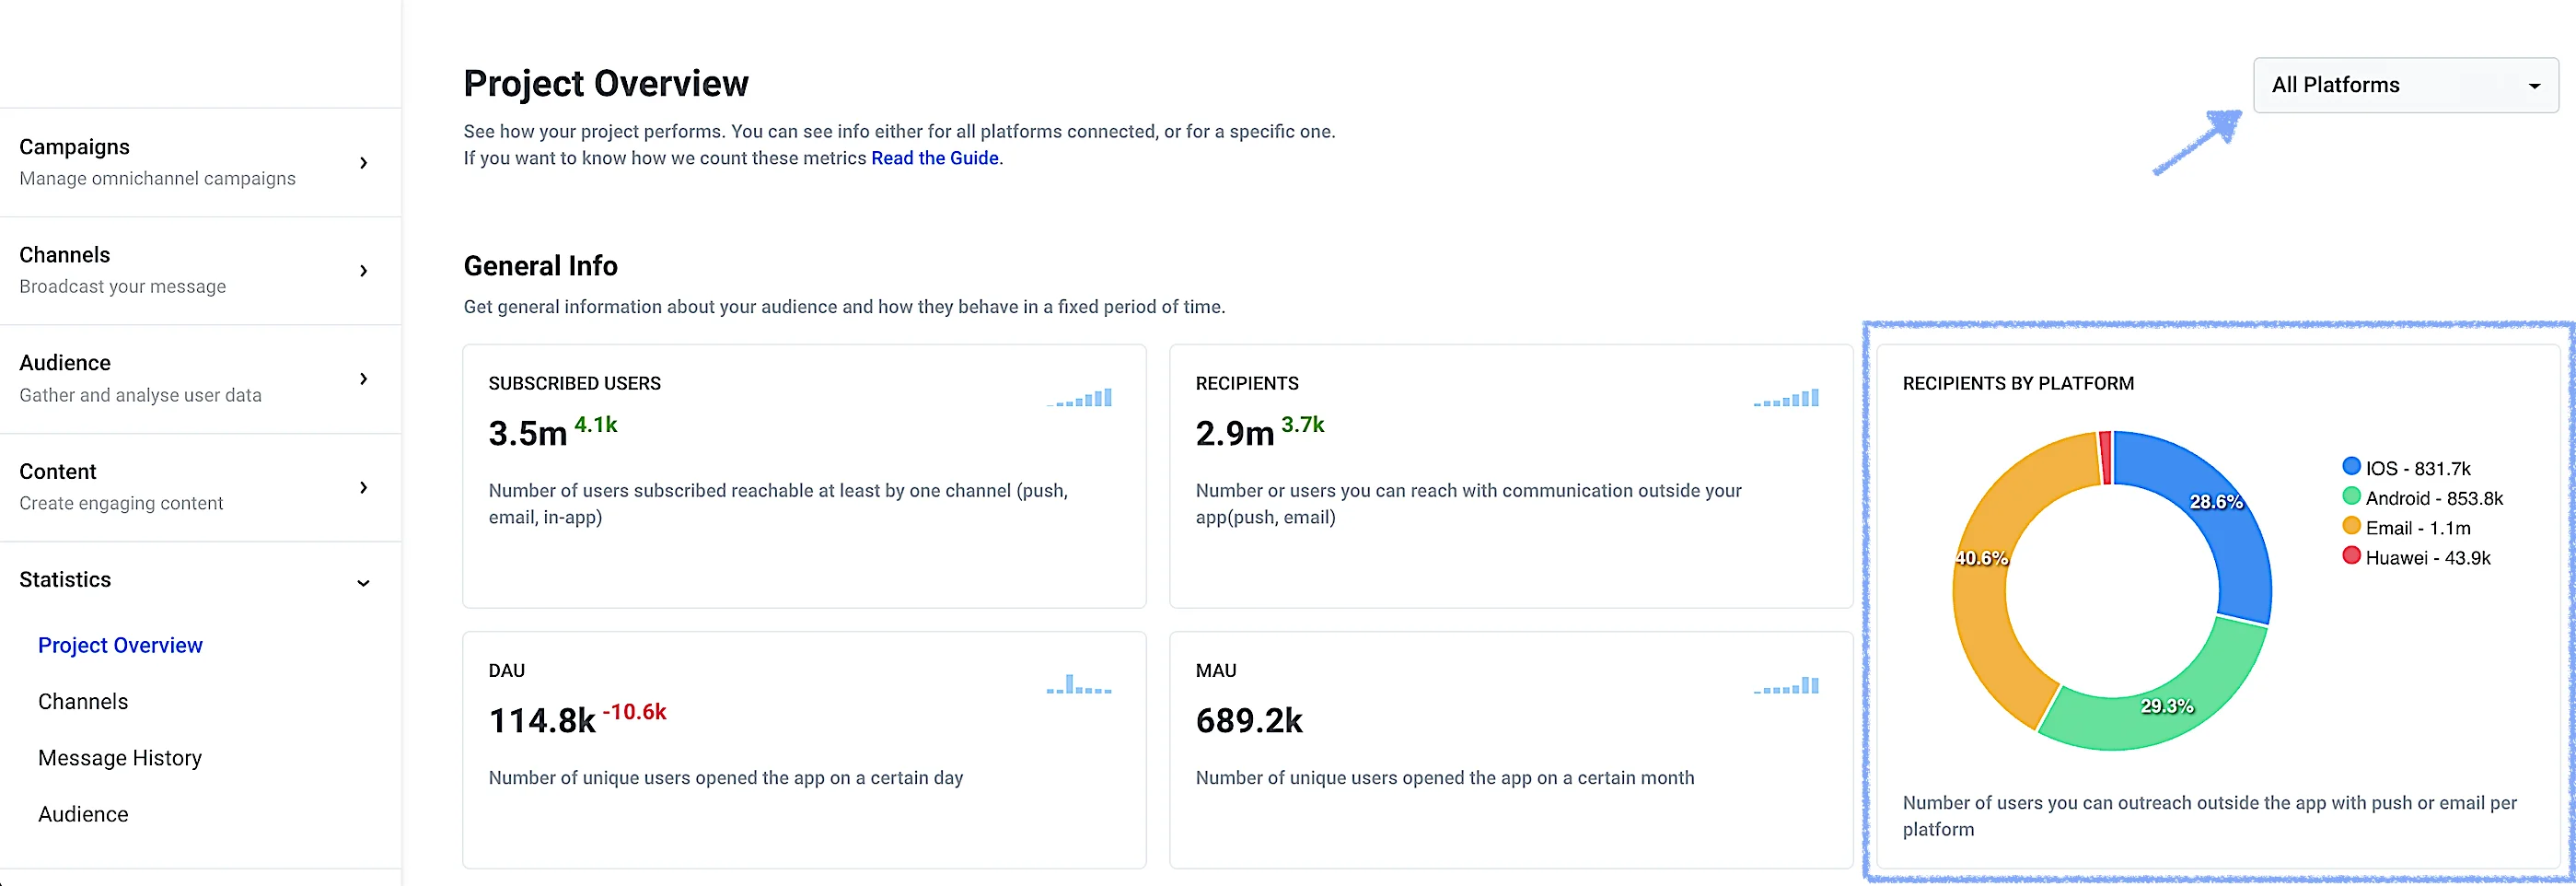
The General Info section indicates your project audience's most recent trends. Here, the overall audience stats across all platforms are displayed by default, though can be narrowed to specific platforms by selecting the needed ones from the drop-down on the top right.
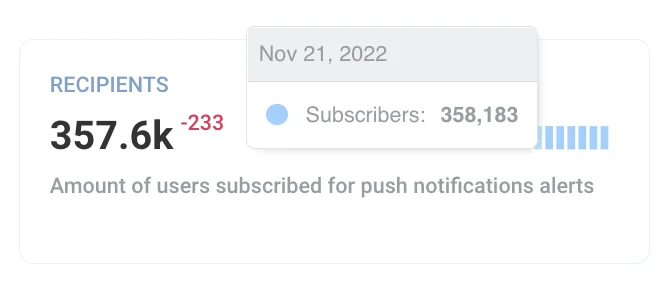
Each of the metrics in General Statistics displays the data of the previous day and the dynamics in comparison with the day before yesterday. For example, in the picture below, the Recipients number decreased by 233 yesterday compared to the day before. Hover over the blue bar next to the number to see the dynamics over the week.
### Subscribed users
The Subscribed Users present the number of **devices with push tokens or emails provided**, meaning they are reachable with push notifications, emails, or In-Apps. This number shows how many users you can reach out to with your communications.
### Recipients
As for Recipients, they are **devices with enabled push notification alerts**, i.e., those users who actually see your pushes. To boost this metric, consider encouraging users to enable push alerts, for example, via In-Apps, by explaining to them the core values your pushes deliver and the benefits they get from being in touch.
### Recipients by platform
On the Recipients by Platform graph, you can see the distribution of recipients (users who actually received your messages) across all selected platforms. The graph presents the percentage, and the legend provides the exact number for each platform.
### DAD (Daily Active Devices)
Daily Active Devices shows the number of unique devices that opened the app on a certain day. DAD includes unique devices only, so it comes in handy for determining the most recently active audience size.
### MAD (Monthly Active Devices)
Monthly Active Devices shows the number of unique devices that opened the app on a certain month. MAD is calculated over the month till the previous day (for example, if you check the stats on November 28, MAD will be calculated over the month starting October 27 to November 27). Monthly Active Devices represent your core audience you are able to engage and retain for the long run.
## Detailed statistics
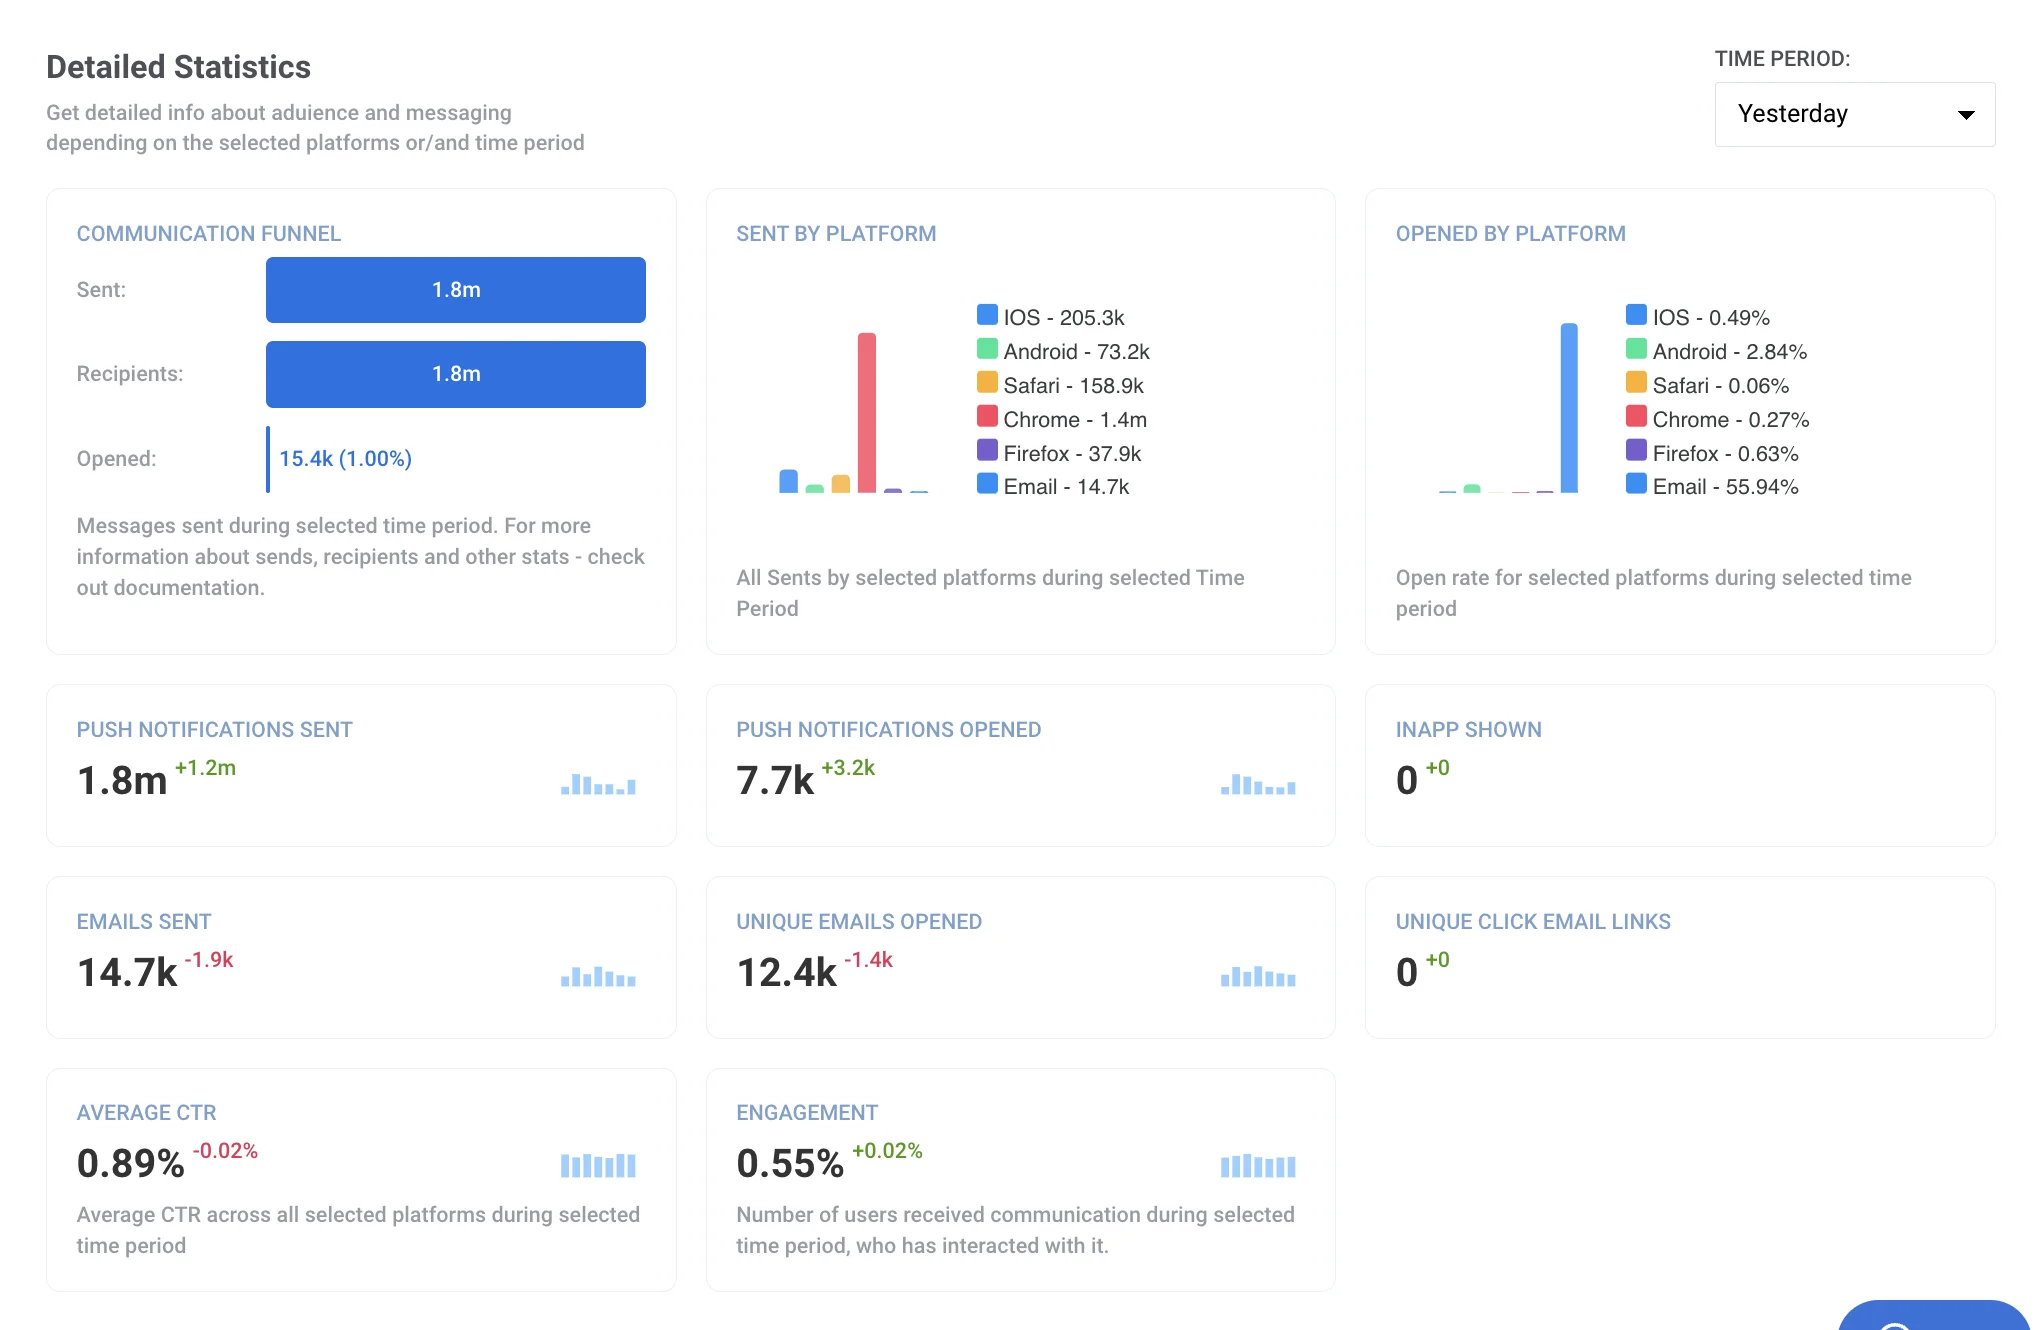
Detailed Statistics let you dive deeper into how your communications performed over the selected period, giving you insights into how the audience interacts with your messages.
By default, yesterday's data is shown in the Detailed Statistics. However, you can **select a period** to get the stats for from the drop-down on the top right of the section: today, yesterday, this week, previous week, this month, previous month, and custom period are available to choose from.
All the dynamics bars (the blue ones next to numbers) are adjusted to the period selected:
* Days for today, yesterday, and this week.
* Weeks for the previous week.
* Months for this month and the previous month.
* The number of days equal to the custom period specified.
For example, if you obtain the previous week's stats, each block will show the dynamics over several previous weeks.
### Communication funnel
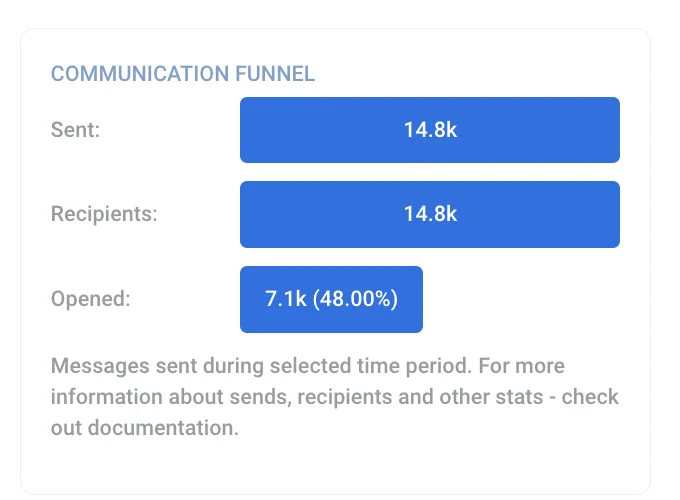
This simple graph clarifies your messaging efficiency with three essential metrics:
* Sent – the number of **push notifications and emails** sent over the selected period.
* Recipients – the size of the target audience of those messages, only including devices with **push notifications enabled or emails permitted**.
* Opened – the number and percentage of users who **opened those messages over the selected period**.
For example, you sent some pushes yesterday, and some users continue opening them today. When "Yesterday" is selected as a stats period, the Communication Funnel graph includes the opens that happened yesterday only.
### Sent by platform
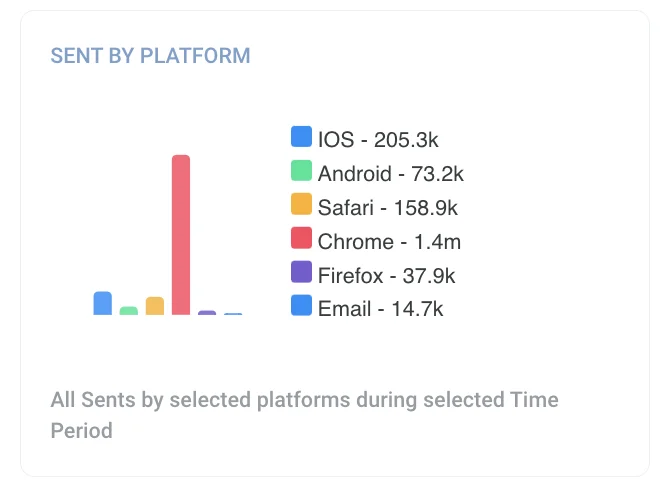
Here, all the messages sent within the selected period are displayed and distributed by selected platforms.
### Opened by platform
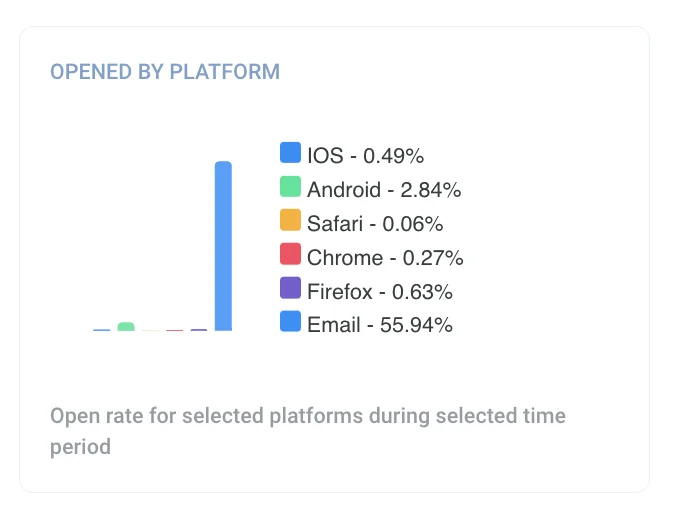
This graph presents the open rates for messages sent to each of the selected platforms within the selected period.
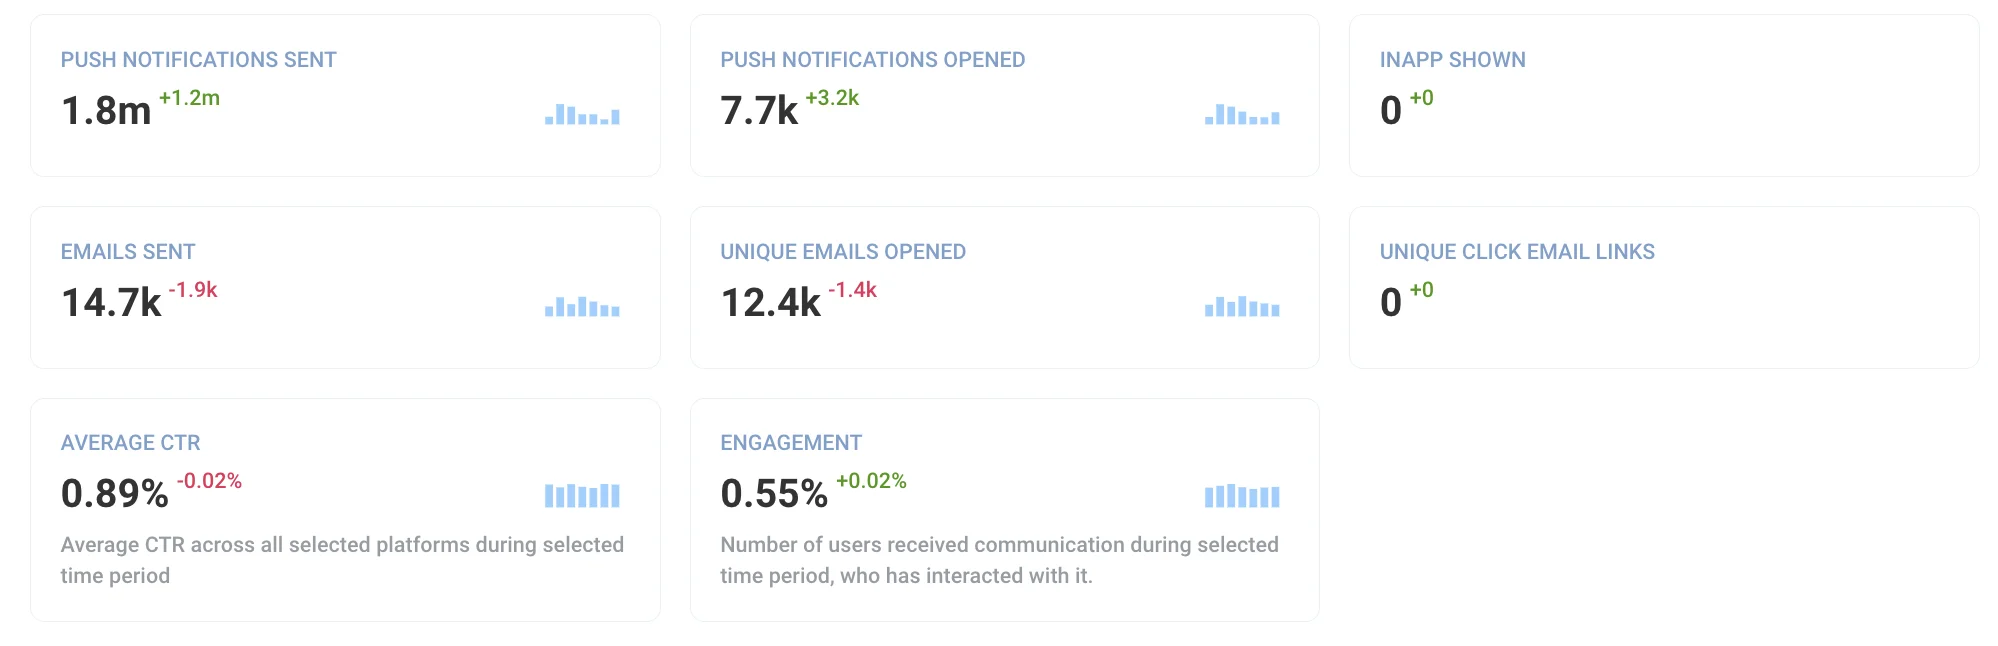
### Push notifications sent
Here, the total number of pushes sent to your audience within the selected period and the dynamics for pushes are displayed.
### Push notifications opened
The total number of opens that happened in the selected period, including opens of pushes sent before that period.
### In-apps shown
The number of In-Apps shown to your app users within the selected period.
### Emails sent
The total number of emails sent to your audience within the selected period and the dynamics for the email channel.
### Unique emails opened
The number of unique email recipients who opened your emails within the specified period.
### Unique click email links
A unique click is an in-email link clicked by a user at least once. That means when a user clicks on a link more than once, it still counts as one unique click.
### Average CTR
The average CTR (Click-Through Rate) for all messages sent to the selected platforms within the period set.
### Engagement
Your audience's engagement rate – the number of users who interacted with your communications (i.e. opened pushes or emails) at least one time within the period selected. This metric includes the unique users only, meaning the user who have opened several pushes, for example, within a month, will be counted only once for this month's engagement rate.
 ## General Info
The General Info section indicates your project audience's most recent trends. Here, the overall audience stats across all platforms are displayed by default, though can be narrowed to specific platforms by selecting the needed ones from the drop-down on the top right.
## General Info
The General Info section indicates your project audience's most recent trends. Here, the overall audience stats across all platforms are displayed by default, though can be narrowed to specific platforms by selecting the needed ones from the drop-down on the top right.
 Each of the metrics in General Statistics displays the data of the previous day and the dynamics in comparison with the day before yesterday. For example, in the picture below, the Recipients number decreased by 233 yesterday compared to the day before. Hover over the blue bar next to the number to see the dynamics over the week.
 ### Subscribed users
The Subscribed Users present the number of **devices with push tokens or emails provided**, meaning they are reachable with push notifications, emails, or In-Apps. This number shows how many users you can reach out to with your communications.
### Recipients
As for Recipients, they are **devices with enabled push notification alerts**, i.e., those users who actually see your pushes. To boost this metric, consider encouraging users to enable push alerts, for example, via In-Apps, by explaining to them the core values your pushes deliver and the benefits they get from being in touch.
### Recipients by platform
On the Recipients by Platform graph, you can see the distribution of recipients (users who actually received your messages) across all selected platforms. The graph presents the percentage, and the legend provides the exact number for each platform.
### Subscribed users
The Subscribed Users present the number of **devices with push tokens or emails provided**, meaning they are reachable with push notifications, emails, or In-Apps. This number shows how many users you can reach out to with your communications.
### Recipients
As for Recipients, they are **devices with enabled push notification alerts**, i.e., those users who actually see your pushes. To boost this metric, consider encouraging users to enable push alerts, for example, via In-Apps, by explaining to them the core values your pushes deliver and the benefits they get from being in touch.
### Recipients by platform
On the Recipients by Platform graph, you can see the distribution of recipients (users who actually received your messages) across all selected platforms. The graph presents the percentage, and the legend provides the exact number for each platform.
 ### DAD (Daily Active Devices)
Daily Active Devices shows the number of unique devices that opened the app on a certain day. DAD includes unique devices only, so it comes in handy for determining the most recently active audience size.
### MAD (Monthly Active Devices)
Monthly Active Devices shows the number of unique devices that opened the app on a certain month. MAD is calculated over the month till the previous day (for example, if you check the stats on November 28, MAD will be calculated over the month starting October 27 to November 27). Monthly Active Devices represent your core audience you are able to engage and retain for the long run.
## Detailed statistics
Detailed Statistics let you dive deeper into how your communications performed over the selected period, giving you insights into how the audience interacts with your messages.
### DAD (Daily Active Devices)
Daily Active Devices shows the number of unique devices that opened the app on a certain day. DAD includes unique devices only, so it comes in handy for determining the most recently active audience size.
### MAD (Monthly Active Devices)
Monthly Active Devices shows the number of unique devices that opened the app on a certain month. MAD is calculated over the month till the previous day (for example, if you check the stats on November 28, MAD will be calculated over the month starting October 27 to November 27). Monthly Active Devices represent your core audience you are able to engage and retain for the long run.
## Detailed statistics
Detailed Statistics let you dive deeper into how your communications performed over the selected period, giving you insights into how the audience interacts with your messages.
 By default, yesterday's data is shown in the Detailed Statistics. However, you can **select a period** to get the stats for from the drop-down on the top right of the section: today, yesterday, this week, previous week, this month, previous month, and custom period are available to choose from.
All the dynamics bars (the blue ones next to numbers) are adjusted to the period selected:
* Days for today, yesterday, and this week.
* Weeks for the previous week.
* Months for this month and the previous month.
* The number of days equal to the custom period specified.
For example, if you obtain the previous week's stats, each block will show the dynamics over several previous weeks.
### Communication funnel
This simple graph clarifies your messaging efficiency with three essential metrics:
* Sent – the number of **push notifications and emails** sent over the selected period.
* Recipients – the size of the target audience of those messages, only including devices with **push notifications enabled or emails permitted**.
* Opened – the number and percentage of users who **opened those messages over the selected period**.
For example, you sent some pushes yesterday, and some users continue opening them today. When "Yesterday" is selected as a stats period, the Communication Funnel graph includes the opens that happened yesterday only.
By default, yesterday's data is shown in the Detailed Statistics. However, you can **select a period** to get the stats for from the drop-down on the top right of the section: today, yesterday, this week, previous week, this month, previous month, and custom period are available to choose from.
All the dynamics bars (the blue ones next to numbers) are adjusted to the period selected:
* Days for today, yesterday, and this week.
* Weeks for the previous week.
* Months for this month and the previous month.
* The number of days equal to the custom period specified.
For example, if you obtain the previous week's stats, each block will show the dynamics over several previous weeks.
### Communication funnel
This simple graph clarifies your messaging efficiency with three essential metrics:
* Sent – the number of **push notifications and emails** sent over the selected period.
* Recipients – the size of the target audience of those messages, only including devices with **push notifications enabled or emails permitted**.
* Opened – the number and percentage of users who **opened those messages over the selected period**.
For example, you sent some pushes yesterday, and some users continue opening them today. When "Yesterday" is selected as a stats period, the Communication Funnel graph includes the opens that happened yesterday only.
 ### Sent by platform
Here, all the messages sent within the selected period are displayed and distributed by selected platforms.
### Sent by platform
Here, all the messages sent within the selected period are displayed and distributed by selected platforms.
 ### Opened by platform
This graph presents the open rates for messages sent to each of the selected platforms within the selected period.
### Opened by platform
This graph presents the open rates for messages sent to each of the selected platforms within the selected period.
 ### Push notifications sent
Here, the total number of pushes sent to your audience within the selected period and the dynamics for pushes are displayed.
### Push notifications opened
The total number of opens that happened in the selected period, including opens of pushes sent before that period.
### In-apps shown
The number of In-Apps shown to your app users within the selected period.
### Emails sent
The total number of emails sent to your audience within the selected period and the dynamics for the email channel.
### Unique emails opened
The number of unique email recipients who opened your emails within the specified period.
### Unique click email links
A unique click is an in-email link clicked by a user at least once. That means when a user clicks on a link more than once, it still counts as one unique click.
### Average CTR
The average CTR (Click-Through Rate) for all messages sent to the selected platforms within the period set.
### Engagement
Your audience's engagement rate – the number of users who interacted with your communications (i.e. opened pushes or emails) at least one time within the period selected. This metric includes the unique users only, meaning the user who have opened several pushes, for example, within a month, will be counted only once for this month's engagement rate.
### Push notifications sent
Here, the total number of pushes sent to your audience within the selected period and the dynamics for pushes are displayed.
### Push notifications opened
The total number of opens that happened in the selected period, including opens of pushes sent before that period.
### In-apps shown
The number of In-Apps shown to your app users within the selected period.
### Emails sent
The total number of emails sent to your audience within the selected period and the dynamics for the email channel.
### Unique emails opened
The number of unique email recipients who opened your emails within the specified period.
### Unique click email links
A unique click is an in-email link clicked by a user at least once. That means when a user clicks on a link more than once, it still counts as one unique click.
### Average CTR
The average CTR (Click-Through Rate) for all messages sent to the selected platforms within the period set.
### Engagement
Your audience's engagement rate – the number of users who interacted with your communications (i.e. opened pushes or emails) at least one time within the period selected. This metric includes the unique users only, meaning the user who have opened several pushes, for example, within a month, will be counted only once for this month's engagement rate.