# Overview page
The **Overview** page shows audience, push, and email trends without setting up a dashboard or report. Check it first to catch a drop in retention or a spike in delivery errors early, rather than a week into a bad trend. Open **Project overview** in the left menu.
* [**App metrics**](#app-metrics-tab): check active users (MAU/DAU), platform reach, and Day 1 / 7 / 14 / 28 retention
* [**Push**](#push-tab): check push audience, delivery performance, and frequency capping impact
* [**Email**](#email-tab): check subscriber base, delivery performance, category and mailbox-provider breakdowns, and frequency capping impact
For high-level messaging reach and engagement, go to [**Statistics → Project Statistics**](/product/statistics-and-analytics/project-overview-statistics/).
## Set the reporting period
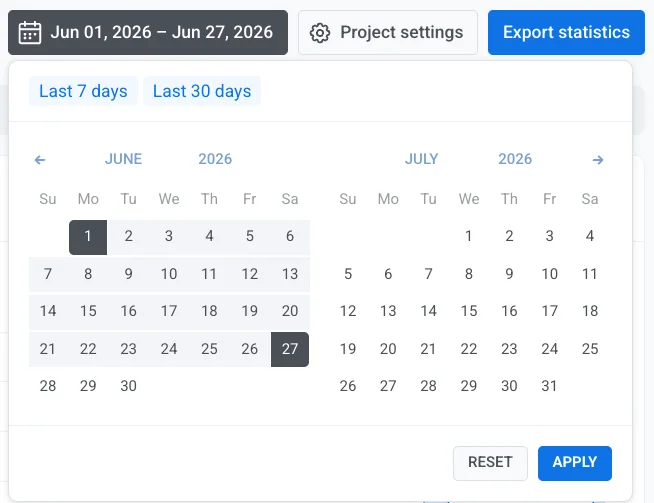
Use the date range picker to choose which period the **Overview** page reports on. Every chart on the **App metrics**, **Push**, and **Email** tabs uses the same range, so you compare metrics for the same window.
By default, the page shows the last 30 days.
To change the period:
1. Click the **date range** picker in the top-right corner, next to **Project settings** and **Export statistics**.
2. Choose **Last 7 days**, **Last 30 days**, or set a custom start and end date on the calendar.
3. Click **Apply**.
## App metrics tab
Check how many users are active in your app and how well you retain them, so you can spot growth or churn early without leaving the project overview.
### Unique users
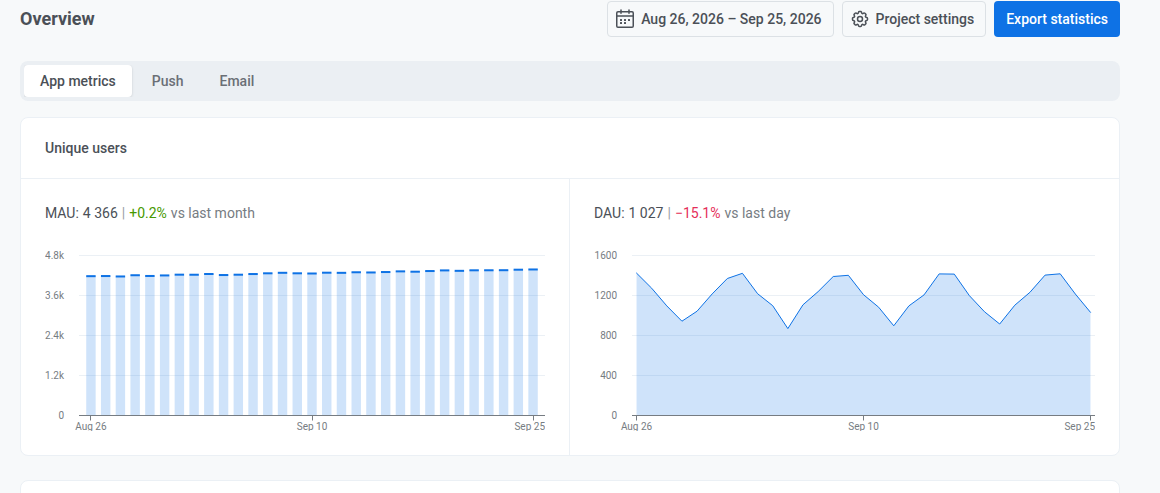
Check the current value and the change compared to the previous month or day:
* **MAU**: monthly active users, over a rolling 30-day window ending on each plotted day
* [**DAU**](/product/statistics-and-analytics/metrics-glossary/#daily-active-users-dau): daily active users, unique users who opened the app that day
### User distribution by platforms
Check how many users are reachable on each channel configured for the project (individual mobile and web push platforms, email, SMS, and chat channels such as WhatsApp, Telegram, and Viber), as of the last day of the selected period.
Treat it as a snapshot, not a sum over the period: the platforms can add up to slightly more than the project total, because every platform a user is reachable on counts them once.
### User retention
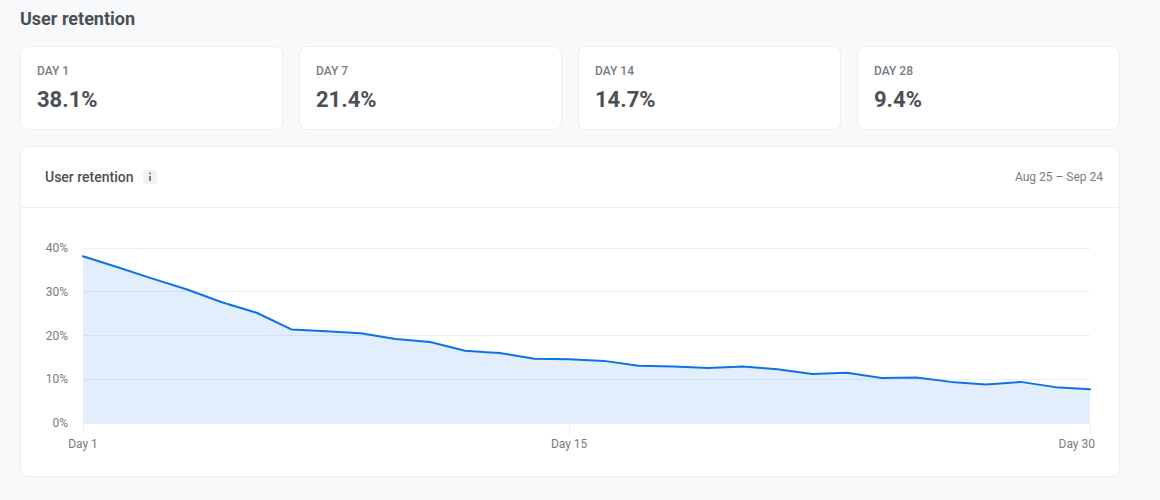
Check **Day 1**, **Day 7**, **Day 14**, and **Day 28** retention to see how many new users return after their first visit, and whether they come back in the first week and stay engaged over the following weeks. Each day counts only users who returned on exactly that day, not everyone who returned by then.
The cohort is everyone who first visited on one specific day, 30 days before the last day with data, not everyone who first visited during your selected period. Changing the date range doesn't change which cohort is shown.
## Push tab
Use this tab to check who you can reach with push, how many pushes got delivered and opened over the selected period, and how frequency capping affected sends.
### Audience
Check your push audience as of the last day of the period and how it changed since.
When more than one push platform is configured for the project, use the **All platforms** dropdown next to the section heading to filter Funnel, Subscribers, and [PAE-reachable](#pae-reachable) by a single platform. Base change, and the Performance and Frequency capping sections below, aren't affected by this dropdown.
#### Funnel
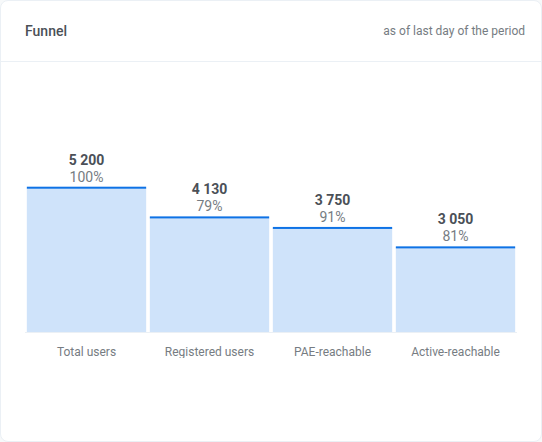
Check the steps from **Total users** down to **Active-reachable**. Each step shows how many users remain and what share that is of the step before it.
The funnel is a snapshot for the last day of the selected period. It does not add up activity across the whole period.
* [**Total users**](/product/statistics-and-analytics/metrics-glossary/#total-users)
* [**Registered users**](/product/statistics-and-analytics/metrics-glossary/#subscribers): has a [push token](/product/first-steps/pushwoosh-glossary/#push-token-also-known-as-device-push-token)
* [**PAE-reachable**](#pae-reachable): users who can actually receive a push
* **Active-reachable**: [PAE-reachable](#pae-reachable) and opened the app in the last 30 days. This window is fixed and doesn't change with the date range you pick.
#### Subscribers
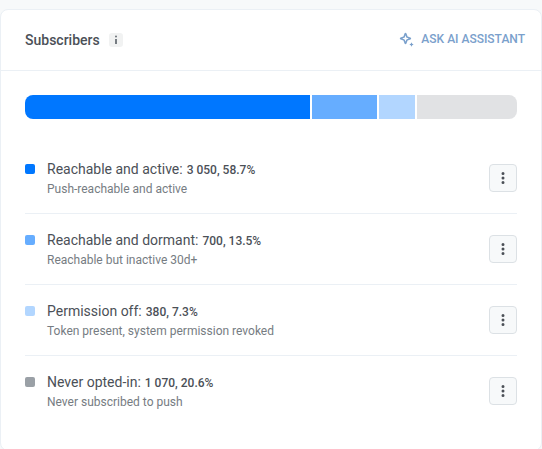
Check which segment each user falls into:
* **Reachable and active**: [PAE-reachable](#pae-reachable) and opened the app in the last 30 days
* **Reachable and dormant**: [PAE-reachable](#pae-reachable) but hasn't opened the app in 30+ days
* **Permission off**: [push token](/product/first-steps/pushwoosh-glossary/#push-token-also-known-as-device-push-token) present, system permission revoked
* **Never opted-in**: no push token, never subscribed to push
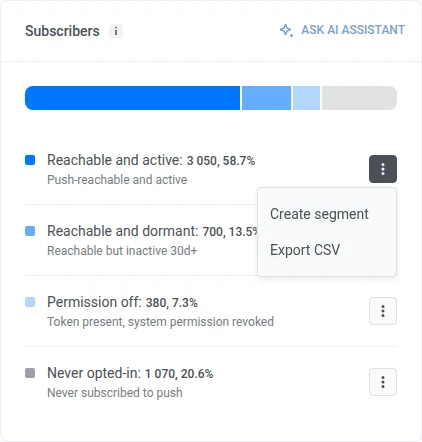
On a row, open the kebab menu and choose **Create segment** or **Export CSV**.
To ask about this audience in chat, click **Ask AI Assistant** in the card header when the AI Assistant is enabled for the account.
#### PAE-reachable
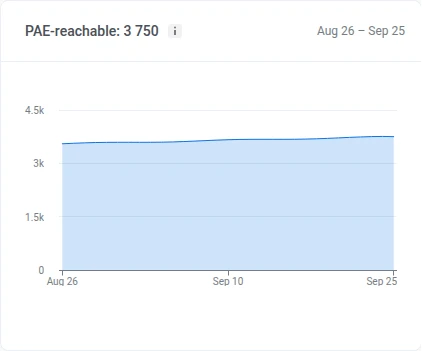
**PAE-reachable** (Push Alerts Enabled): users who can actually receive a push. Pushwoosh has a valid push token for their device, and they haven't turned off notifications in their phone or browser settings.
Check how many users could receive a push each day of the period. A drop usually means people turned off notifications or uninstalled the app. A rise means new opt-ins.
#### Base change
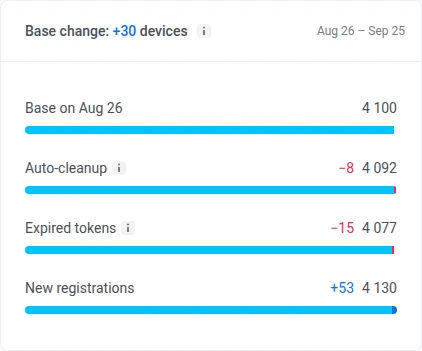
Check how many subscribers left the base through auto-cleanup and expired tokens, and how many joined it through new registrations, since the start of the period. Each row's bar is sized against the base at the start of the period:
* **Auto-cleanup:** removes a device's [push token](/product/first-steps/pushwoosh-glossary/#push-token-also-known-as-device-push-token) once the app has gone unopened past the account's inactivity limit. See [automatic inactivity cleanup](/product/messaging-channels/push-notifications/manage-push-subscriber-base/#automatically-remove-inactive-tokens-after-90-days-with-autovalidation).
* **Expired tokens:** a device whose push token APNs or FCM reported invalid, based on gateway responses only. See [invalid push tokens](/product/messaging-channels/push-notifications/manage-push-subscriber-base/#how-to-keep-your-subscriber-list-clean-by-removing-invalid-push-tokens).
* **New registrations:** devices that registered for push during the period
Pushwoosh only keeps this breakdown for the last 60 days. If your period starts earlier, the line under the breakdown shows the date it's actually counted from.
### Performance
Check push delivery and engagement for the period, then open the daily breakdown by platform.
Switch the dropdown above **Sent**, **Delivery rate**, **Open-to-sent rate**, and **Errors**:
* **By sends:** every send counted separately
* **By uniques:** each recipient counted once. In this mode, the first metric becomes **Recipients**: unique devices the push was delivered to during the period, each counted once even if they received several sends.
Check these summary metrics for the period:
* **Sent:** how many pushes went out (becomes **Recipients** in **By uniques** mode)
* [**Delivery rate**](/product/statistics-and-analytics/metrics-glossary/#delivery-rate): how deliveries compare to sends (includes the delivery count)
* [**Open-to-sent rate**](/product/statistics-and-analytics/metrics-glossary/#open-to-sent-rate): how opens compare to sends (includes the open count)
* **Errors:** how many sends failed
#### Daily performance
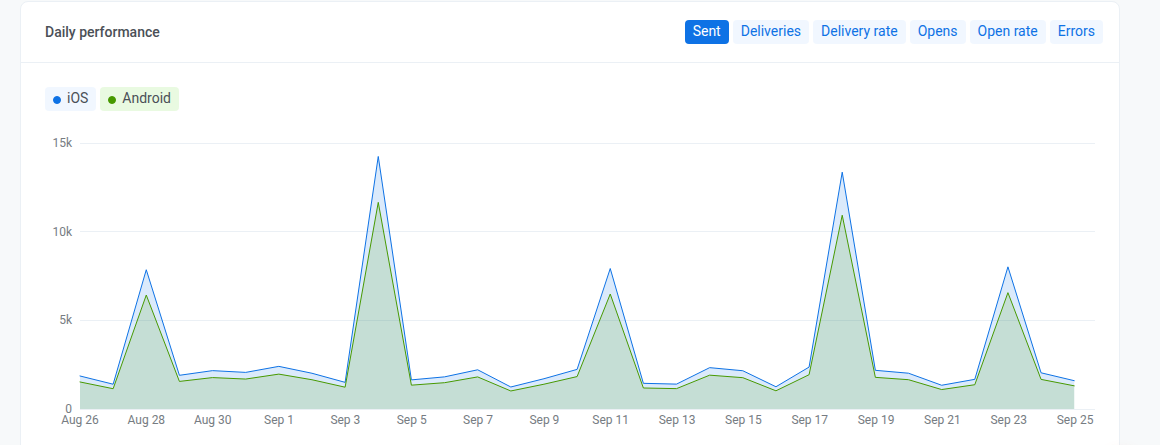
Check these metrics per day, split by platform. Switch metrics with the chips above the chart: **Sent**, **Deliveries**, **Delivery rate**, **Opens**, **Open rate**, and **Errors**.
### Frequency capping
Check how [frequency capping](/product/messaging-channels/global-frequency-capping/) affected sends over the period.
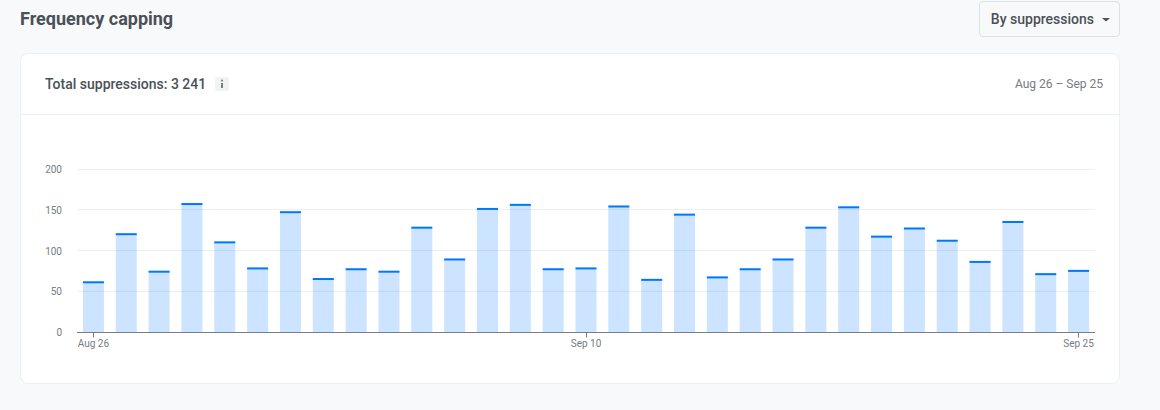
The chart shows how many pushes frequency capping blocked, or how many users it affected, per day for the period. The [**Total suppressions**](/product/statistics-and-analytics/metrics-glossary/#total-suppressions) figure in the header sums the same for the whole period. Switch what both count with the selector:
* [**By suppressions**](/product/statistics-and-analytics/metrics-glossary/#suppressions): how many times a message was blocked by frequency capping
* [**By users**](/product/statistics-and-analytics/metrics-glossary/#affected-users): how many unique users were affected
## Email tab
Use this tab to check subscriber-base health, engagement, category and mailbox-provider breakdowns, and frequency capping impact over the selected period.
### Audience
Check your subscriber base, what changed it, and how engaged subscribers are.
#### Subscribers base
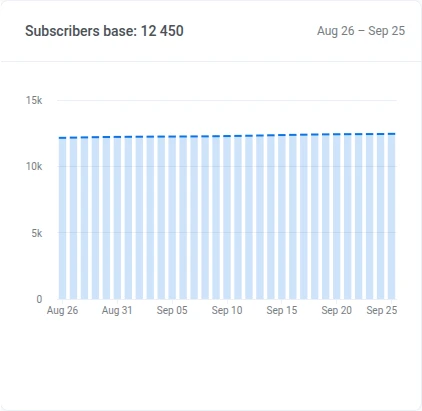
Check the subscriber count trend for the period.
#### Base change
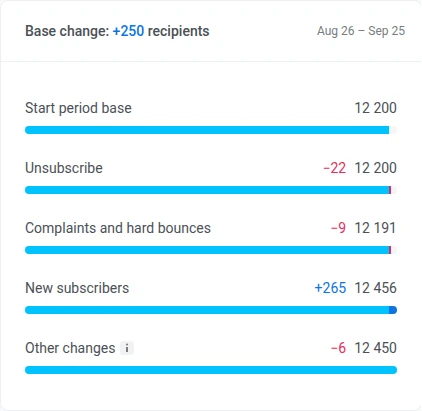
Check how many subscribers the base lost through complaints or hard bounces, and how many it gained through new subscribers, since the start of the period. Unsubscribes and other changes are tracked too, but don't remove the address on their own. Each row's bar is sized against the base at the start of the period:
* **Unsubscribe:** subscribers who [unsubscribed](/product/statistics-and-analytics/metrics-glossary/#email-unsubscribed) in the period. The address stays on the base, so this never reduces it.
* **Complaints and hard bounces:** subscribers Pushwoosh added to the [suppression list](/product/messaging-channels/emails/email-suppression-list/) for a spam complaint or a hard bounce, counted once even if both happened
* **New subscribers:** devices or addresses that subscribed to email during the period
* **Other changes:** everything the two flows above don't cover: daily snapshot offset, a second address on an existing user, transfers between accounts and migrations, deleted devices and users, and base cleanups. Can be positive or negative.
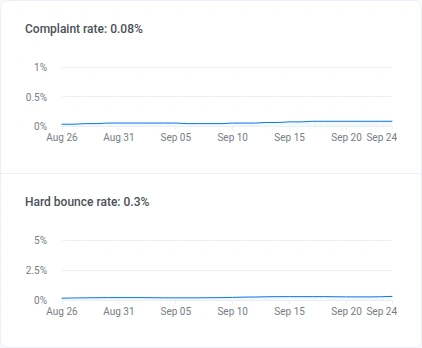
#### Complaint rate and Hard bounce rate
Check the [**Complaint rate**](/product/statistics-and-analytics/metrics-glossary/#complaint-rate) and [**Hard bounce rate**](/product/statistics-and-analytics/metrics-glossary/#hard-bounce-rate) over the period and the current value in the header.
#### Subscribers activity distribution
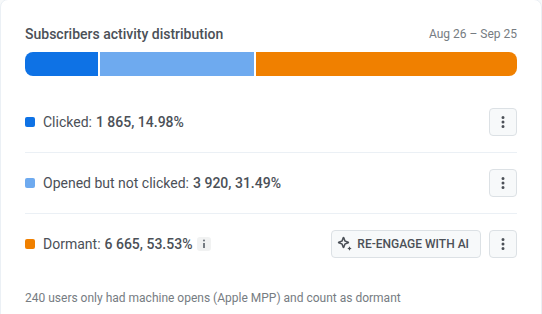
Check how the [**Subscribers activity distribution**](/product/statistics-and-analytics/metrics-glossary/#subscribers-activity-distribution) splits into these groups, with each count and share of the base:
* **Clicked**
* **Opened but not clicked**
* **Dormant:** no open in the period
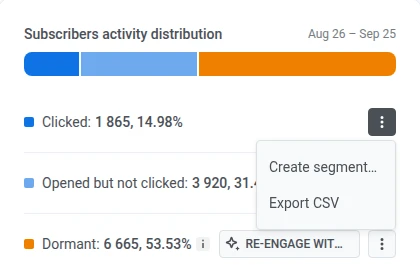
On a row, open the kebab menu and choose **Create segment** or **Export CSV**.
On the **Dormant** row, click **Re-engage with AI** when the AI Assistant is enabled for the account.
### Event-triggered performance
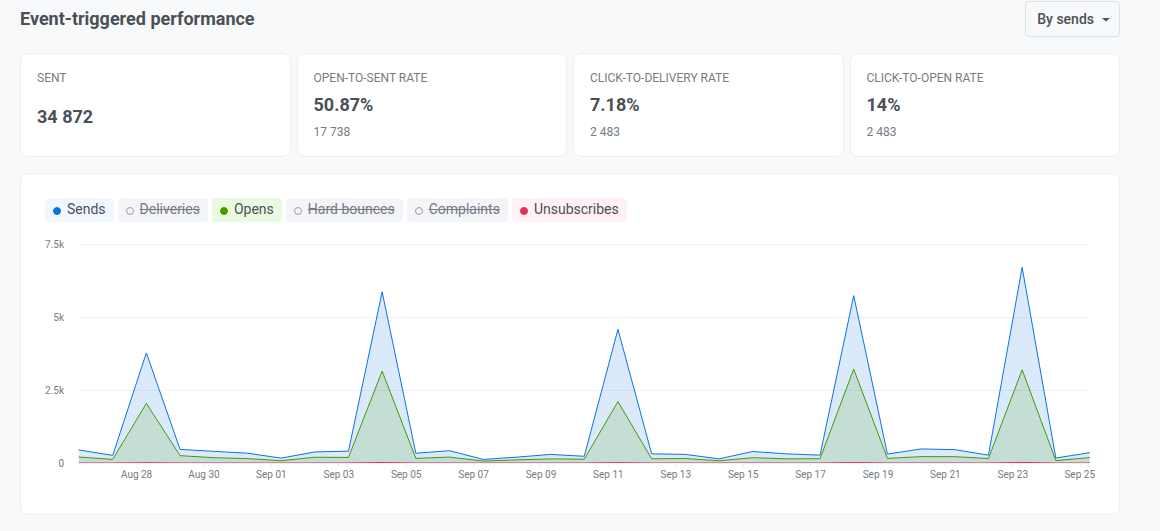
Check email delivery and engagement totals for the period, then open the daily breakdown.
Switch the dropdown above **Sent**, **Open-to-sent rate**, **Click-to-delivery rate**, and **Click-to-open rate**:
* **By sends:** every send counted separately
* **By uniques:** each recipient counted once
Check these summary metrics for the period:
* **Sent:** how many emails went out (volume for the period)
* [**Open-to-sent rate**](/product/statistics-and-analytics/metrics-glossary/#open-to-sent-rate): how opens compare to sends, whether the send got opened
* [**Click-to-delivery rate**](/product/statistics-and-analytics/metrics-glossary/#click-to-delivery-rate): how clicks compare to deliveries, whether delivered mail drove clicks
* [**Click-to-open rate**](/product/statistics-and-analytics/metrics-glossary/#click-to-open-rate): how clicks compare to opens, whether openers engaged further
#### Daily chart
Click a chip above the chart to add or remove a line:
* On by default: **Sends**, **Opens**, **Unsubscribes**
* Start off: **Deliveries**, **Hard bounces**, **Complaints**
### Category-based performance
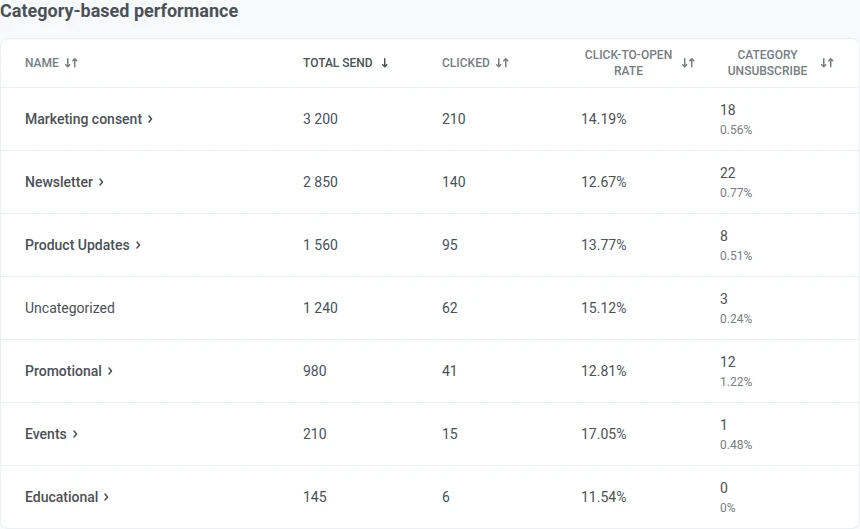
Check send performance by [email category](/product/messaging-channels/emails/email-preferences/).
When the table is available:
* Sends with no category attached are grouped under **Uncategorized**.
* Click a column header to sort.
If no categories are set up yet, this section shows a card to set them up instead of the table.
### Mailbox providers
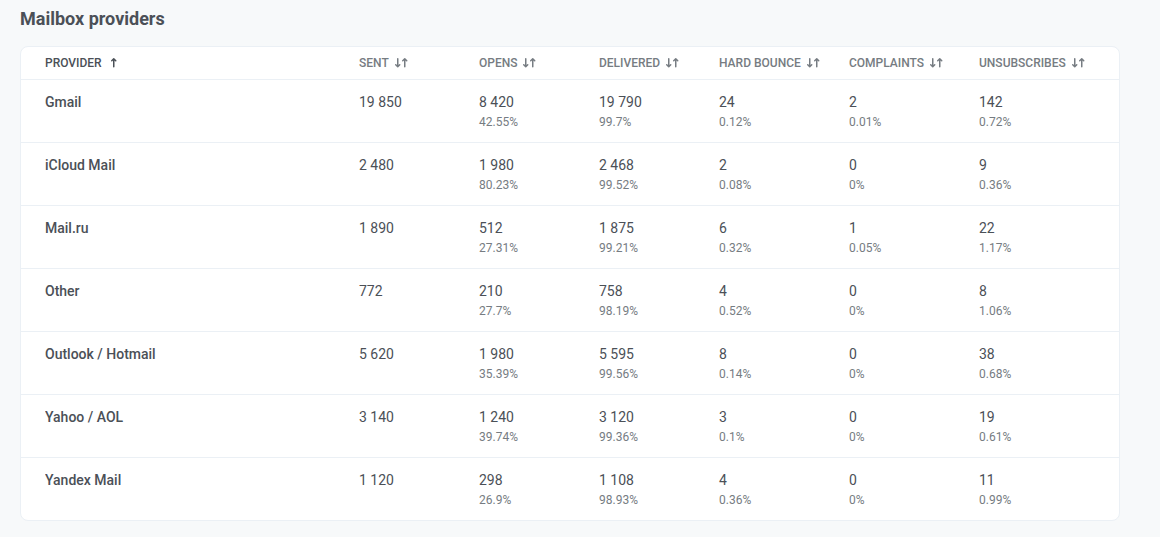
Check send performance by the recipient's mailbox provider (Gmail, Outlook, and so on).
Providers Pushwoosh can't attribute a send to are grouped under **Other**. Click a column header to sort.
### Frequency capping
Check how [frequency capping](/product/messaging-channels/global-frequency-capping/) affected email sends over the period.
#### Total suppressions
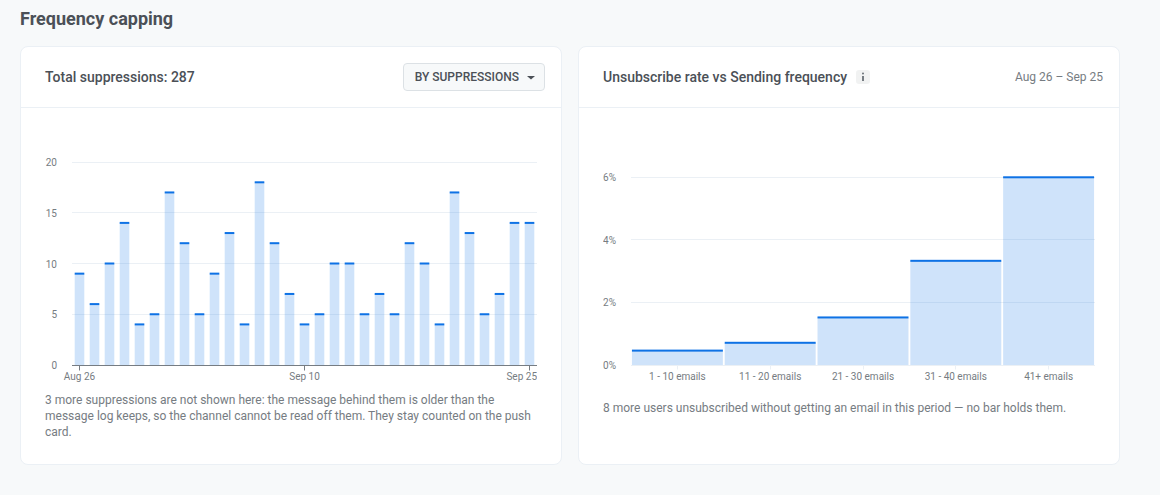
The chart shows how many emails frequency capping blocked, or how many subscribers it affected, per day for the period. The [**Total suppressions**](/product/statistics-and-analytics/metrics-glossary/#total-suppressions) figure in the header sums the same for the whole period. Switch what both count with the selector:
* [**By suppressions**](/product/statistics-and-analytics/metrics-glossary/#suppressions): how many times a message was blocked by frequency capping
* [**By users**](/product/statistics-and-analytics/metrics-glossary/#affected-users): how many unique users were affected
A suppression tied to a message sent more than 30 days before the start of the period can't be attributed to a channel, so it's excluded here and counted on the Push tab's Total suppressions instead. If that happened, read the line below the chart for how many.
#### Unsubscribe rate vs Sending frequency
Use this chart to see whether people who get more emails in the period also unsubscribe more often. This is a correlation, not a cause: an unsubscribe isn't necessarily triggered by those specific emails.
Subscribers are grouped by how many emails they received in the period. Each group shows its unsubscribe rate.
Subscribers who unsubscribed but received no email in the period are left out of every group. If any were left out, a line below the chart shows how many.
## Export statistics
Use **Export statistics** in the page header to download data.
1. Click **Export statistics**.
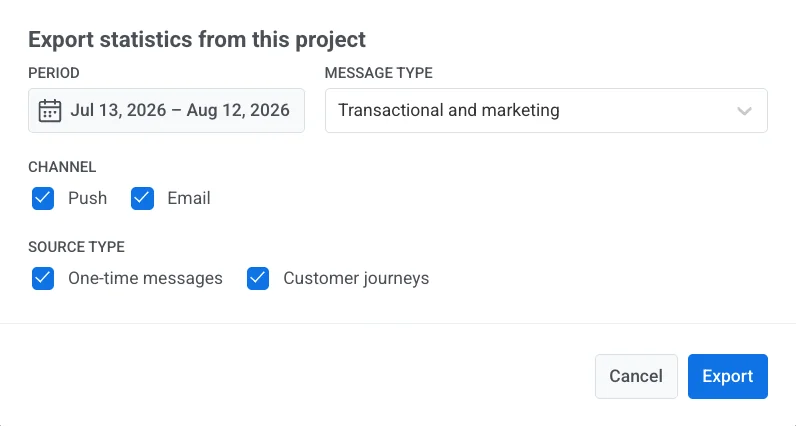
2. Set the export options in the **Export statistics from this project** modal:
* **Period:** defaults to the range currently selected on the page.
* **Message type:** Transactional and marketing, Only marketing, or Only transactional.
* **Channel:** Push and/or Email.
* **Source Type:** One-time messages and/or Customer journeys.
3. Click **Export**.
After you finish on Overview, open [User retention statistics](/product/statistics-and-analytics/user-retention-statistics/) for custom retention events, [Messaging statistics](/product/statistics-and-analytics/messaging-statistics/) for per-message detail, or [Dashboards](/product/statistics-and-analytics/dashboards/) for custom charts.
 3. Click **Apply**.
## App metrics tab
Check how many users are active in your app and how well you retain them, so you can spot growth or churn early without leaving the project overview.
### Unique users
Check the current value and the change compared to the previous month or day:
* **MAU**: monthly active users, over a rolling 30-day window ending on each plotted day
* [**DAU**](/product/statistics-and-analytics/metrics-glossary/#daily-active-users-dau): daily active users, unique users who opened the app that day
3. Click **Apply**.
## App metrics tab
Check how many users are active in your app and how well you retain them, so you can spot growth or churn early without leaving the project overview.
### Unique users
Check the current value and the change compared to the previous month or day:
* **MAU**: monthly active users, over a rolling 30-day window ending on each plotted day
* [**DAU**](/product/statistics-and-analytics/metrics-glossary/#daily-active-users-dau): daily active users, unique users who opened the app that day
 ### User distribution by platforms
Check how many users are reachable on each channel configured for the project (individual mobile and web push platforms, email, SMS, and chat channels such as WhatsApp, Telegram, and Viber), as of the last day of the selected period.
### User distribution by platforms
Check how many users are reachable on each channel configured for the project (individual mobile and web push platforms, email, SMS, and chat channels such as WhatsApp, Telegram, and Viber), as of the last day of the selected period.
 Treat it as a snapshot, not a sum over the period: the platforms can add up to slightly more than the project total, because every platform a user is reachable on counts them once.
### User retention
Check **Day 1**, **Day 7**, **Day 14**, and **Day 28** retention to see how many new users return after their first visit, and whether they come back in the first week and stay engaged over the following weeks. Each day counts only users who returned on exactly that day, not everyone who returned by then.
The cohort is everyone who first visited on one specific day, 30 days before the last day with data, not everyone who first visited during your selected period. Changing the date range doesn't change which cohort is shown.
Treat it as a snapshot, not a sum over the period: the platforms can add up to slightly more than the project total, because every platform a user is reachable on counts them once.
### User retention
Check **Day 1**, **Day 7**, **Day 14**, and **Day 28** retention to see how many new users return after their first visit, and whether they come back in the first week and stay engaged over the following weeks. Each day counts only users who returned on exactly that day, not everyone who returned by then.
The cohort is everyone who first visited on one specific day, 30 days before the last day with data, not everyone who first visited during your selected period. Changing the date range doesn't change which cohort is shown.
 ## Push tab
Use this tab to check who you can reach with push, how many pushes got delivered and opened over the selected period, and how frequency capping affected sends.
### Audience
Check your push audience as of the last day of the period and how it changed since.
When more than one push platform is configured for the project, use the **All platforms** dropdown next to the section heading to filter Funnel, Subscribers, and [PAE-reachable](#pae-reachable) by a single platform. Base change, and the Performance and Frequency capping sections below, aren't affected by this dropdown.
#### Funnel
Check the steps from **Total users** down to **Active-reachable**. Each step shows how many users remain and what share that is of the step before it.
The funnel is a snapshot for the last day of the selected period. It does not add up activity across the whole period.
## Push tab
Use this tab to check who you can reach with push, how many pushes got delivered and opened over the selected period, and how frequency capping affected sends.
### Audience
Check your push audience as of the last day of the period and how it changed since.
When more than one push platform is configured for the project, use the **All platforms** dropdown next to the section heading to filter Funnel, Subscribers, and [PAE-reachable](#pae-reachable) by a single platform. Base change, and the Performance and Frequency capping sections below, aren't affected by this dropdown.
#### Funnel
Check the steps from **Total users** down to **Active-reachable**. Each step shows how many users remain and what share that is of the step before it.
The funnel is a snapshot for the last day of the selected period. It does not add up activity across the whole period.
 * [**Total users**](/product/statistics-and-analytics/metrics-glossary/#total-users)
* [**Registered users**](/product/statistics-and-analytics/metrics-glossary/#subscribers): has a [push token](/product/first-steps/pushwoosh-glossary/#push-token-also-known-as-device-push-token)
* [**PAE-reachable**](#pae-reachable): users who can actually receive a push
* **Active-reachable**: [PAE-reachable](#pae-reachable) and opened the app in the last 30 days. This window is fixed and doesn't change with the date range you pick.
#### Subscribers
Check which segment each user falls into:
* [**Total users**](/product/statistics-and-analytics/metrics-glossary/#total-users)
* [**Registered users**](/product/statistics-and-analytics/metrics-glossary/#subscribers): has a [push token](/product/first-steps/pushwoosh-glossary/#push-token-also-known-as-device-push-token)
* [**PAE-reachable**](#pae-reachable): users who can actually receive a push
* **Active-reachable**: [PAE-reachable](#pae-reachable) and opened the app in the last 30 days. This window is fixed and doesn't change with the date range you pick.
#### Subscribers
Check which segment each user falls into:
 * **Reachable and active**: [PAE-reachable](#pae-reachable) and opened the app in the last 30 days
* **Reachable and dormant**: [PAE-reachable](#pae-reachable) but hasn't opened the app in 30+ days
* **Permission off**: [push token](/product/first-steps/pushwoosh-glossary/#push-token-also-known-as-device-push-token) present, system permission revoked
* **Never opted-in**: no push token, never subscribed to push
On a row, open the kebab menu and choose **Create segment** or **Export CSV**.
* **Reachable and active**: [PAE-reachable](#pae-reachable) and opened the app in the last 30 days
* **Reachable and dormant**: [PAE-reachable](#pae-reachable) but hasn't opened the app in 30+ days
* **Permission off**: [push token](/product/first-steps/pushwoosh-glossary/#push-token-also-known-as-device-push-token) present, system permission revoked
* **Never opted-in**: no push token, never subscribed to push
On a row, open the kebab menu and choose **Create segment** or **Export CSV**.
 To ask about this audience in chat, click **Ask AI Assistant** in the card header when the AI Assistant is enabled for the account.
 #### PAE-reachable
**PAE-reachable** (Push Alerts Enabled): users who can actually receive a push. Pushwoosh has a valid push token for their device, and they haven't turned off notifications in their phone or browser settings.
Check how many users could receive a push each day of the period. A drop usually means people turned off notifications or uninstalled the app. A rise means new opt-ins.
#### PAE-reachable
**PAE-reachable** (Push Alerts Enabled): users who can actually receive a push. Pushwoosh has a valid push token for their device, and they haven't turned off notifications in their phone or browser settings.
Check how many users could receive a push each day of the period. A drop usually means people turned off notifications or uninstalled the app. A rise means new opt-ins.
 #### Base change
Check how many subscribers left the base through auto-cleanup and expired tokens, and how many joined it through new registrations, since the start of the period. Each row's bar is sized against the base at the start of the period:
#### Base change
Check how many subscribers left the base through auto-cleanup and expired tokens, and how many joined it through new registrations, since the start of the period. Each row's bar is sized against the base at the start of the period:
 * **Auto-cleanup:** removes a device's [push token](/product/first-steps/pushwoosh-glossary/#push-token-also-known-as-device-push-token) once the app has gone unopened past the account's inactivity limit. See [automatic inactivity cleanup](/product/messaging-channels/push-notifications/manage-push-subscriber-base/#automatically-remove-inactive-tokens-after-90-days-with-autovalidation).
* **Expired tokens:** a device whose push token APNs or FCM reported invalid, based on gateway responses only. See [invalid push tokens](/product/messaging-channels/push-notifications/manage-push-subscriber-base/#how-to-keep-your-subscriber-list-clean-by-removing-invalid-push-tokens).
* **New registrations:** devices that registered for push during the period
Pushwoosh only keeps this breakdown for the last 60 days. If your period starts earlier, the line under the breakdown shows the date it's actually counted from.
### Performance
Check push delivery and engagement for the period, then open the daily breakdown by platform.
* **Auto-cleanup:** removes a device's [push token](/product/first-steps/pushwoosh-glossary/#push-token-also-known-as-device-push-token) once the app has gone unopened past the account's inactivity limit. See [automatic inactivity cleanup](/product/messaging-channels/push-notifications/manage-push-subscriber-base/#automatically-remove-inactive-tokens-after-90-days-with-autovalidation).
* **Expired tokens:** a device whose push token APNs or FCM reported invalid, based on gateway responses only. See [invalid push tokens](/product/messaging-channels/push-notifications/manage-push-subscriber-base/#how-to-keep-your-subscriber-list-clean-by-removing-invalid-push-tokens).
* **New registrations:** devices that registered for push during the period
Pushwoosh only keeps this breakdown for the last 60 days. If your period starts earlier, the line under the breakdown shows the date it's actually counted from.
### Performance
Check push delivery and engagement for the period, then open the daily breakdown by platform.
 Switch the dropdown above **Sent**, **Delivery rate**, **Open-to-sent rate**, and **Errors**:
* **By sends:** every send counted separately
* **By uniques:** each recipient counted once. In this mode, the first metric becomes **Recipients**: unique devices the push was delivered to during the period, each counted once even if they received several sends.
Check these summary metrics for the period:
* **Sent:** how many pushes went out (becomes **Recipients** in **By uniques** mode)
* [**Delivery rate**](/product/statistics-and-analytics/metrics-glossary/#delivery-rate): how deliveries compare to sends (includes the delivery count)
* [**Open-to-sent rate**](/product/statistics-and-analytics/metrics-glossary/#open-to-sent-rate): how opens compare to sends (includes the open count)
* **Errors:** how many sends failed
#### Daily performance
Check these metrics per day, split by platform. Switch metrics with the chips above the chart: **Sent**, **Deliveries**, **Delivery rate**, **Opens**, **Open rate**, and **Errors**.
Switch the dropdown above **Sent**, **Delivery rate**, **Open-to-sent rate**, and **Errors**:
* **By sends:** every send counted separately
* **By uniques:** each recipient counted once. In this mode, the first metric becomes **Recipients**: unique devices the push was delivered to during the period, each counted once even if they received several sends.
Check these summary metrics for the period:
* **Sent:** how many pushes went out (becomes **Recipients** in **By uniques** mode)
* [**Delivery rate**](/product/statistics-and-analytics/metrics-glossary/#delivery-rate): how deliveries compare to sends (includes the delivery count)
* [**Open-to-sent rate**](/product/statistics-and-analytics/metrics-glossary/#open-to-sent-rate): how opens compare to sends (includes the open count)
* **Errors:** how many sends failed
#### Daily performance
Check these metrics per day, split by platform. Switch metrics with the chips above the chart: **Sent**, **Deliveries**, **Delivery rate**, **Opens**, **Open rate**, and **Errors**.
 ### Frequency capping
Check how [frequency capping](/product/messaging-channels/global-frequency-capping/) affected sends over the period.
### Frequency capping
Check how [frequency capping](/product/messaging-channels/global-frequency-capping/) affected sends over the period.
 The chart shows how many pushes frequency capping blocked, or how many users it affected, per day for the period. The [**Total suppressions**](/product/statistics-and-analytics/metrics-glossary/#total-suppressions) figure in the header sums the same for the whole period. Switch what both count with the selector:
* [**By suppressions**](/product/statistics-and-analytics/metrics-glossary/#suppressions): how many times a message was blocked by frequency capping
* [**By users**](/product/statistics-and-analytics/metrics-glossary/#affected-users): how many unique users were affected
## Email tab
Use this tab to check subscriber-base health, engagement, category and mailbox-provider breakdowns, and frequency capping impact over the selected period.
### Audience
Check your subscriber base, what changed it, and how engaged subscribers are.
#### Subscribers base
Check the subscriber count trend for the period.
The chart shows how many pushes frequency capping blocked, or how many users it affected, per day for the period. The [**Total suppressions**](/product/statistics-and-analytics/metrics-glossary/#total-suppressions) figure in the header sums the same for the whole period. Switch what both count with the selector:
* [**By suppressions**](/product/statistics-and-analytics/metrics-glossary/#suppressions): how many times a message was blocked by frequency capping
* [**By users**](/product/statistics-and-analytics/metrics-glossary/#affected-users): how many unique users were affected
## Email tab
Use this tab to check subscriber-base health, engagement, category and mailbox-provider breakdowns, and frequency capping impact over the selected period.
### Audience
Check your subscriber base, what changed it, and how engaged subscribers are.
#### Subscribers base
Check the subscriber count trend for the period.
 #### Base change
Check how many subscribers the base lost through complaints or hard bounces, and how many it gained through new subscribers, since the start of the period. Unsubscribes and other changes are tracked too, but don't remove the address on their own. Each row's bar is sized against the base at the start of the period:
#### Base change
Check how many subscribers the base lost through complaints or hard bounces, and how many it gained through new subscribers, since the start of the period. Unsubscribes and other changes are tracked too, but don't remove the address on their own. Each row's bar is sized against the base at the start of the period:
 * **Unsubscribe:** subscribers who [unsubscribed](/product/statistics-and-analytics/metrics-glossary/#email-unsubscribed) in the period. The address stays on the base, so this never reduces it.
* **Complaints and hard bounces:** subscribers Pushwoosh added to the [suppression list](/product/messaging-channels/emails/email-suppression-list/) for a spam complaint or a hard bounce, counted once even if both happened
* **New subscribers:** devices or addresses that subscribed to email during the period
* **Other changes:** everything the two flows above don't cover: daily snapshot offset, a second address on an existing user, transfers between accounts and migrations, deleted devices and users, and base cleanups. Can be positive or negative.
#### Complaint rate and Hard bounce rate
Check the [**Complaint rate**](/product/statistics-and-analytics/metrics-glossary/#complaint-rate) and [**Hard bounce rate**](/product/statistics-and-analytics/metrics-glossary/#hard-bounce-rate) over the period and the current value in the header.
* **Unsubscribe:** subscribers who [unsubscribed](/product/statistics-and-analytics/metrics-glossary/#email-unsubscribed) in the period. The address stays on the base, so this never reduces it.
* **Complaints and hard bounces:** subscribers Pushwoosh added to the [suppression list](/product/messaging-channels/emails/email-suppression-list/) for a spam complaint or a hard bounce, counted once even if both happened
* **New subscribers:** devices or addresses that subscribed to email during the period
* **Other changes:** everything the two flows above don't cover: daily snapshot offset, a second address on an existing user, transfers between accounts and migrations, deleted devices and users, and base cleanups. Can be positive or negative.
#### Complaint rate and Hard bounce rate
Check the [**Complaint rate**](/product/statistics-and-analytics/metrics-glossary/#complaint-rate) and [**Hard bounce rate**](/product/statistics-and-analytics/metrics-glossary/#hard-bounce-rate) over the period and the current value in the header.
 #### Subscribers activity distribution
Check how the [**Subscribers activity distribution**](/product/statistics-and-analytics/metrics-glossary/#subscribers-activity-distribution) splits into these groups, with each count and share of the base:
#### Subscribers activity distribution
Check how the [**Subscribers activity distribution**](/product/statistics-and-analytics/metrics-glossary/#subscribers-activity-distribution) splits into these groups, with each count and share of the base:
 * **Clicked**
* **Opened but not clicked**
* **Dormant:** no open in the period
On a row, open the kebab menu and choose **Create segment** or **Export CSV**.
* **Clicked**
* **Opened but not clicked**
* **Dormant:** no open in the period
On a row, open the kebab menu and choose **Create segment** or **Export CSV**.
 On the **Dormant** row, click **Re-engage with AI** when the AI Assistant is enabled for the account.
 ### Event-triggered performance
Check email delivery and engagement totals for the period, then open the daily breakdown.
### Event-triggered performance
Check email delivery and engagement totals for the period, then open the daily breakdown.
 Switch the dropdown above **Sent**, **Open-to-sent rate**, **Click-to-delivery rate**, and **Click-to-open rate**:
* **By sends:** every send counted separately
* **By uniques:** each recipient counted once
Check these summary metrics for the period:
* **Sent:** how many emails went out (volume for the period)
* [**Open-to-sent rate**](/product/statistics-and-analytics/metrics-glossary/#open-to-sent-rate): how opens compare to sends, whether the send got opened
* [**Click-to-delivery rate**](/product/statistics-and-analytics/metrics-glossary/#click-to-delivery-rate): how clicks compare to deliveries, whether delivered mail drove clicks
* [**Click-to-open rate**](/product/statistics-and-analytics/metrics-glossary/#click-to-open-rate): how clicks compare to opens, whether openers engaged further
#### Daily chart
Click a chip above the chart to add or remove a line:
* On by default: **Sends**, **Opens**, **Unsubscribes**
* Start off: **Deliveries**, **Hard bounces**, **Complaints**
### Category-based performance
Check send performance by [email category](/product/messaging-channels/emails/email-preferences/).
Switch the dropdown above **Sent**, **Open-to-sent rate**, **Click-to-delivery rate**, and **Click-to-open rate**:
* **By sends:** every send counted separately
* **By uniques:** each recipient counted once
Check these summary metrics for the period:
* **Sent:** how many emails went out (volume for the period)
* [**Open-to-sent rate**](/product/statistics-and-analytics/metrics-glossary/#open-to-sent-rate): how opens compare to sends, whether the send got opened
* [**Click-to-delivery rate**](/product/statistics-and-analytics/metrics-glossary/#click-to-delivery-rate): how clicks compare to deliveries, whether delivered mail drove clicks
* [**Click-to-open rate**](/product/statistics-and-analytics/metrics-glossary/#click-to-open-rate): how clicks compare to opens, whether openers engaged further
#### Daily chart
Click a chip above the chart to add or remove a line:
* On by default: **Sends**, **Opens**, **Unsubscribes**
* Start off: **Deliveries**, **Hard bounces**, **Complaints**
### Category-based performance
Check send performance by [email category](/product/messaging-channels/emails/email-preferences/).
 When the table is available:
* Sends with no category attached are grouped under **Uncategorized**.
* Click a column header to sort.
If no categories are set up yet, this section shows a card to set them up instead of the table.
### Mailbox providers
Check send performance by the recipient's mailbox provider (Gmail, Outlook, and so on).
When the table is available:
* Sends with no category attached are grouped under **Uncategorized**.
* Click a column header to sort.
If no categories are set up yet, this section shows a card to set them up instead of the table.
### Mailbox providers
Check send performance by the recipient's mailbox provider (Gmail, Outlook, and so on).
 Providers Pushwoosh can't attribute a send to are grouped under **Other**. Click a column header to sort.
### Frequency capping
Check how [frequency capping](/product/messaging-channels/global-frequency-capping/) affected email sends over the period.
Providers Pushwoosh can't attribute a send to are grouped under **Other**. Click a column header to sort.
### Frequency capping
Check how [frequency capping](/product/messaging-channels/global-frequency-capping/) affected email sends over the period.
 #### Total suppressions
The chart shows how many emails frequency capping blocked, or how many subscribers it affected, per day for the period. The [**Total suppressions**](/product/statistics-and-analytics/metrics-glossary/#total-suppressions) figure in the header sums the same for the whole period. Switch what both count with the selector:
* [**By suppressions**](/product/statistics-and-analytics/metrics-glossary/#suppressions): how many times a message was blocked by frequency capping
* [**By users**](/product/statistics-and-analytics/metrics-glossary/#affected-users): how many unique users were affected
A suppression tied to a message sent more than 30 days before the start of the period can't be attributed to a channel, so it's excluded here and counted on the Push tab's Total suppressions instead. If that happened, read the line below the chart for how many.
#### Unsubscribe rate vs Sending frequency
Use this chart to see whether people who get more emails in the period also unsubscribe more often. This is a correlation, not a cause: an unsubscribe isn't necessarily triggered by those specific emails.
Subscribers are grouped by how many emails they received in the period. Each group shows its unsubscribe rate.
Subscribers who unsubscribed but received no email in the period are left out of every group. If any were left out, a line below the chart shows how many.
## Export statistics
Use **Export statistics** in the page header to download data.
1. Click **Export statistics**.
2. Set the export options in the **Export statistics from this project** modal:
* **Period:** defaults to the range currently selected on the page.
* **Message type:** Transactional and marketing, Only marketing, or Only transactional.
* **Channel:** Push and/or Email.
* **Source Type:** One-time messages and/or Customer journeys.
#### Total suppressions
The chart shows how many emails frequency capping blocked, or how many subscribers it affected, per day for the period. The [**Total suppressions**](/product/statistics-and-analytics/metrics-glossary/#total-suppressions) figure in the header sums the same for the whole period. Switch what both count with the selector:
* [**By suppressions**](/product/statistics-and-analytics/metrics-glossary/#suppressions): how many times a message was blocked by frequency capping
* [**By users**](/product/statistics-and-analytics/metrics-glossary/#affected-users): how many unique users were affected
A suppression tied to a message sent more than 30 days before the start of the period can't be attributed to a channel, so it's excluded here and counted on the Push tab's Total suppressions instead. If that happened, read the line below the chart for how many.
#### Unsubscribe rate vs Sending frequency
Use this chart to see whether people who get more emails in the period also unsubscribe more often. This is a correlation, not a cause: an unsubscribe isn't necessarily triggered by those specific emails.
Subscribers are grouped by how many emails they received in the period. Each group shows its unsubscribe rate.
Subscribers who unsubscribed but received no email in the period are left out of every group. If any were left out, a line below the chart shows how many.
## Export statistics
Use **Export statistics** in the page header to download data.
1. Click **Export statistics**.
2. Set the export options in the **Export statistics from this project** modal:
* **Period:** defaults to the range currently selected on the page.
* **Message type:** Transactional and marketing, Only marketing, or Only transactional.
* **Channel:** Push and/or Email.
* **Source Type:** One-time messages and/or Customer journeys.
 3. Click **Export**.
After you finish on Overview, open [User retention statistics](/product/statistics-and-analytics/user-retention-statistics/) for custom retention events, [Messaging statistics](/product/statistics-and-analytics/messaging-statistics/) for per-message detail, or [Dashboards](/product/statistics-and-analytics/dashboards/) for custom charts.
3. Click **Export**.
After you finish on Overview, open [User retention statistics](/product/statistics-and-analytics/user-retention-statistics/) for custom retention events, [Messaging statistics](/product/statistics-and-analytics/messaging-statistics/) for per-message detail, or [Dashboards](/product/statistics-and-analytics/dashboards/) for custom charts.