# Push notification statistics
With Pushwoosh, you can effortlessly track how well your push notifications are performing, both individually and overall as a channel.
This guide explains how to use Pushwoosh's push notification analytics tools to monitor performance, identify trends, and optimize messaging strategy.
## Track individual push message performance in Customer Journey
You can easily track the performance of push notifications sent as part of your customer journey directly on the canvas. To view the metrics, simply hover over a message you want to track or enable the **Show Metrics** toggle located at the bottom of the canvas.
This will display the following performance data for each push notification in your journey.
| Goals reached | Indicates the number of users who reached the Conversion Goal at that specific point. |
| --------------------- | ----------------------------------------------------------------------------------------------------------------------- |
| Opened | Displays the number of messages opened by users. |
| CTR | Represents the percentage of users who clicked on (opened) the push notification after receiving it. |
| Drop-offs | Represents the number of messages that couldn't be sent for some reason (for example, if a user's push token had expired) |
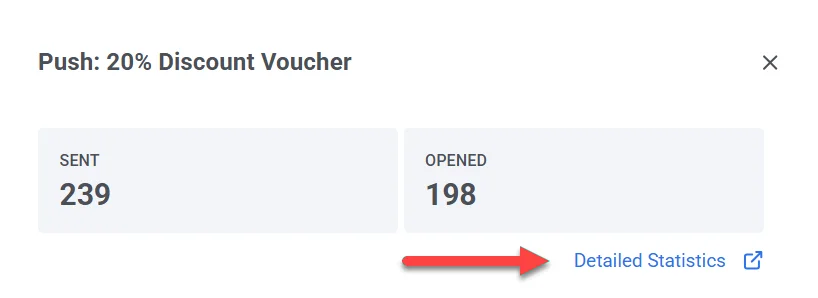
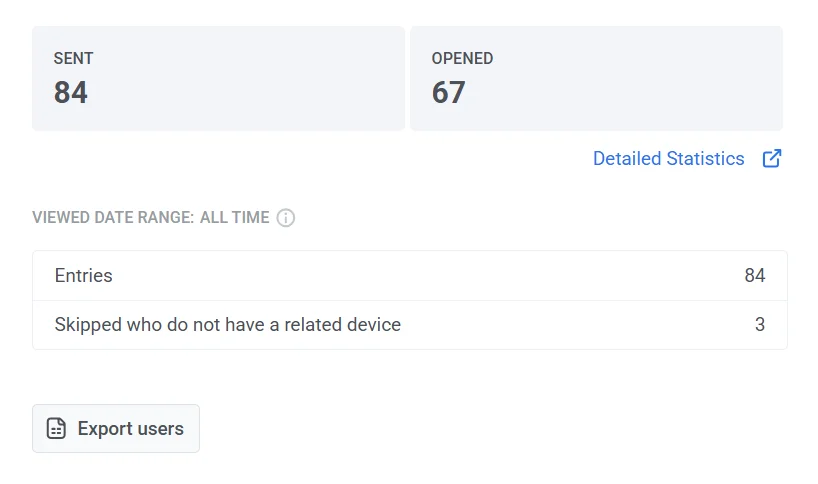
For more detailed insights into the effectiveness of a push notification, double-click on the message element on the canvas. This action will open a detailed statistics window, presenting key metrics specific to the message, including:
* Total number of messages sent
* Total number of messages opened
* Total number of entries
* The number of users who skipped this message element due to the absence of a related device.
## View detailed push notification statistics
To access detailed statistics for a push notification, follow these steps:
1. **Via One-time messages:**
* Navigate to **Campaigns > One-time messages**.
* Select the message you want to analyze.
* Click on the message to open the statistics window.
2. **For notifications in a Journey:**
* Open the **Journey** canvas.
* Select the **Push** element within the Journey.
* Click **Detailed statistics** to view performance insights.
## Push message stats overview
The **Message statistics** section is divided into several tabs, each providing different insights into your push notification campaigns:
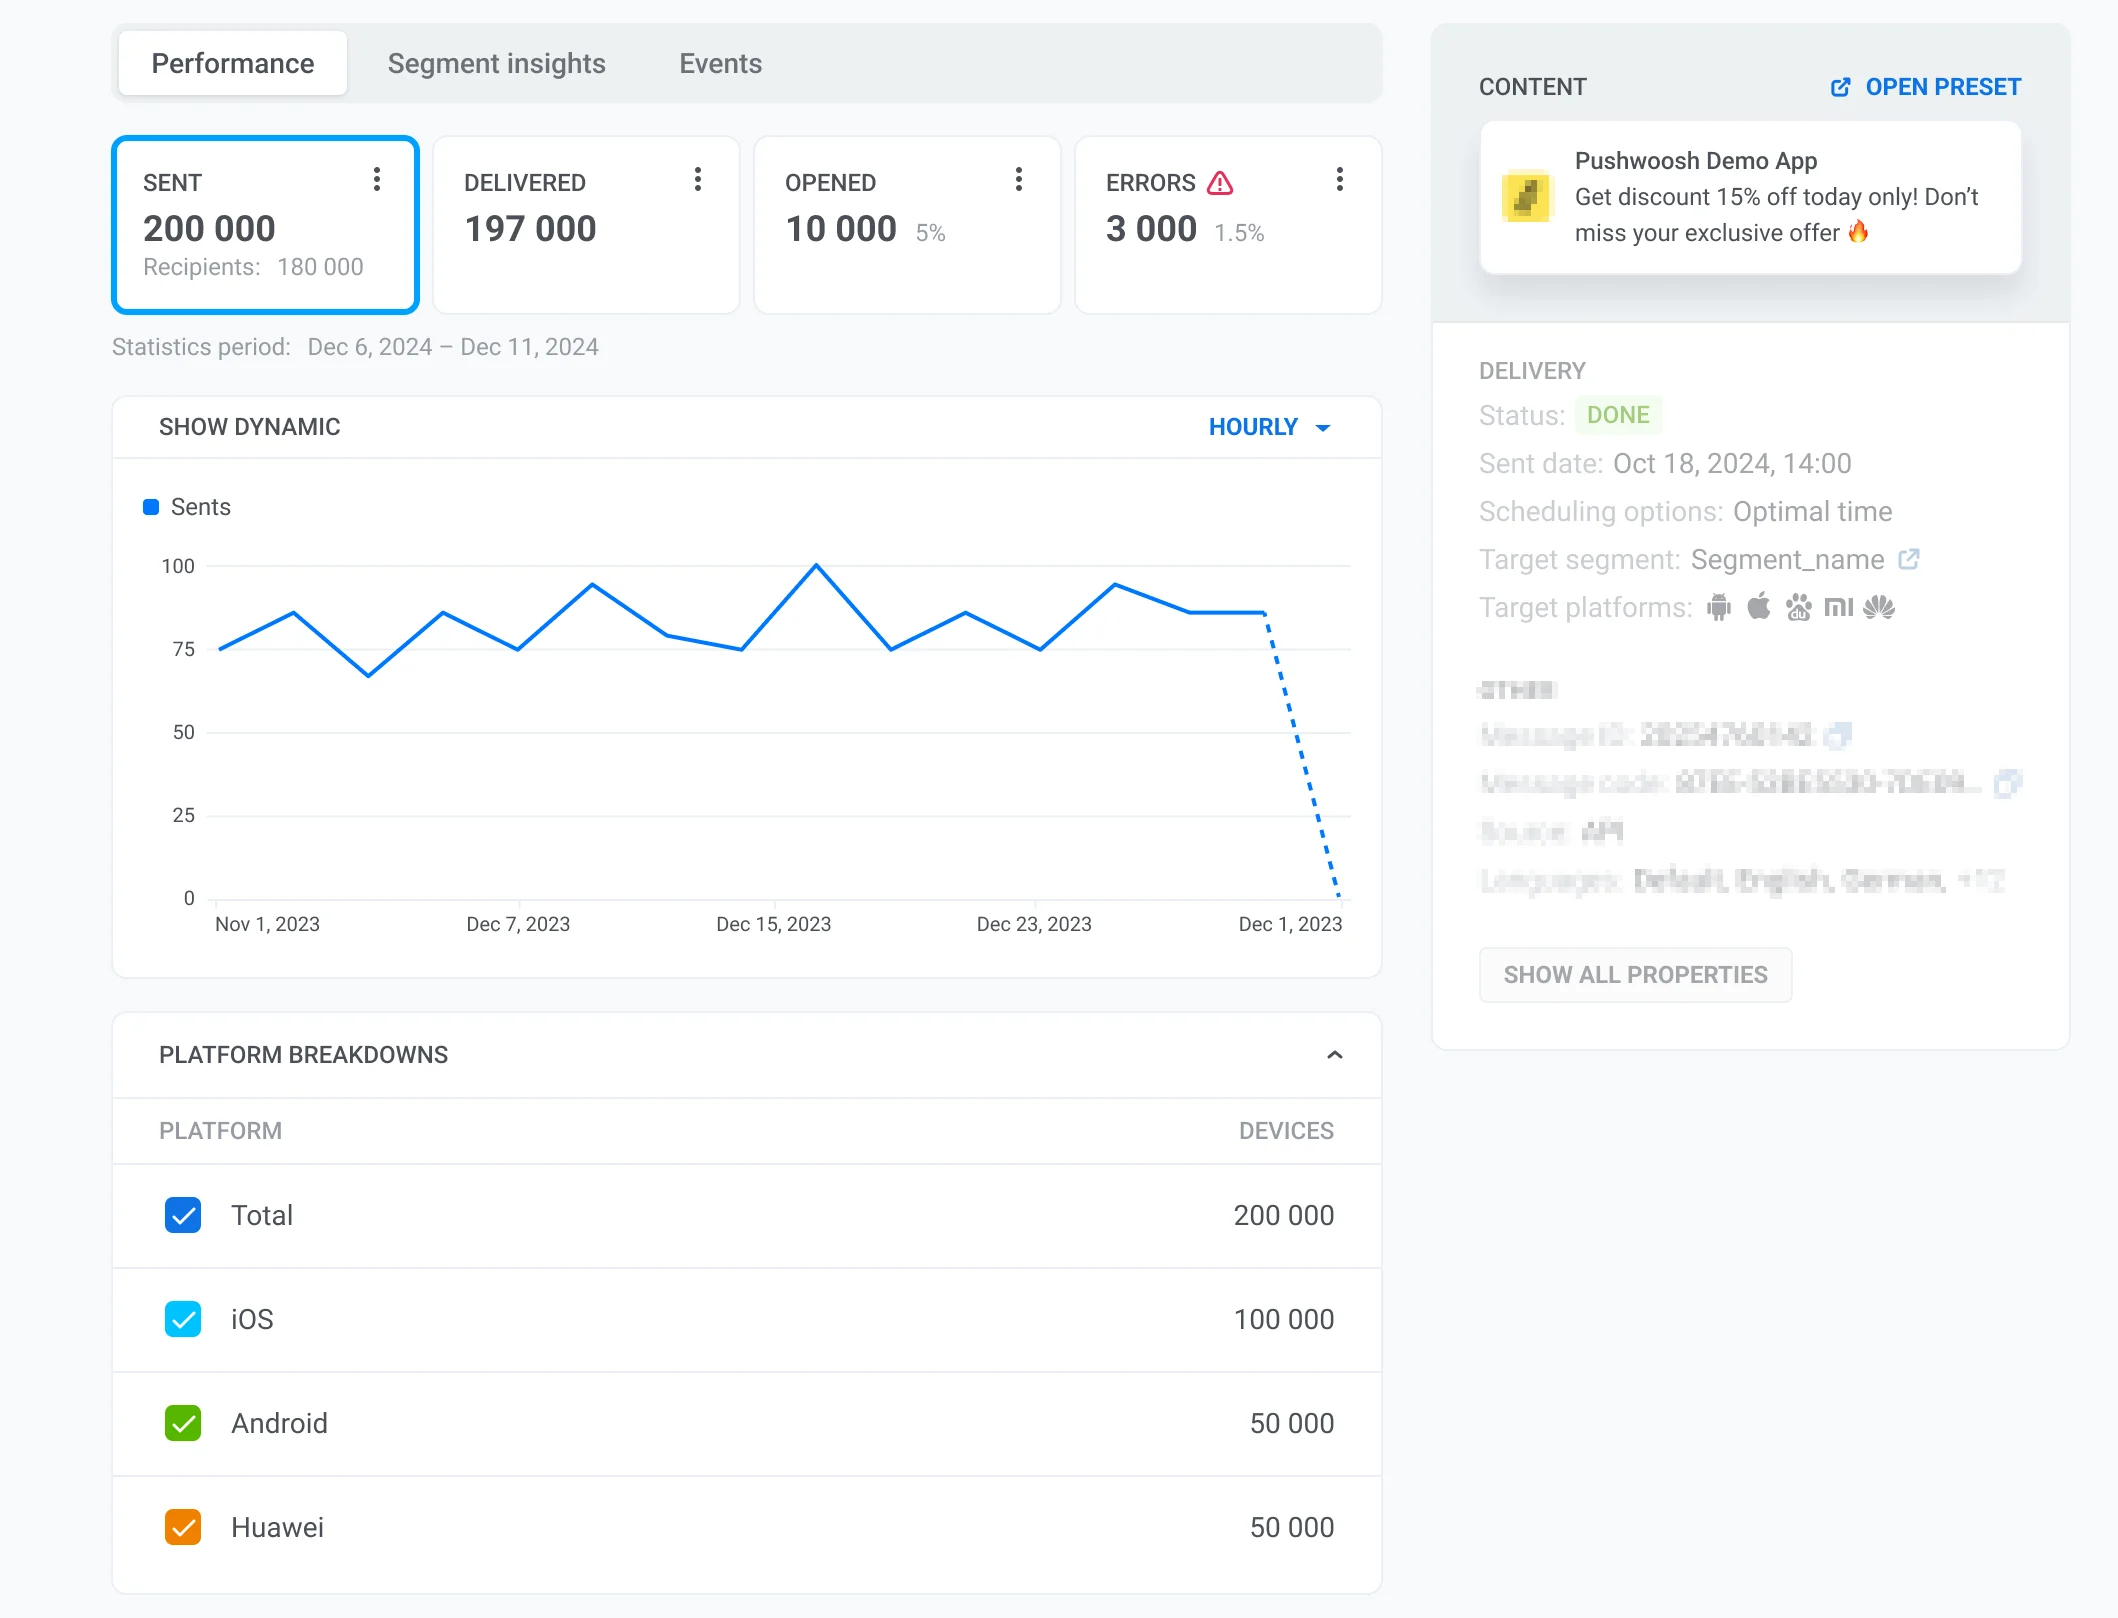
* **Performance tab:** Displays key performance metrics, including **SENT**, **DELIVERED UNIQUE**, **OPENED**, and **ERRORS**. The tab includes dynamic graphs to track trends over time and a platform breakdown so you can analyze performance across different operating systems. The **ERRORS** metric highlights delivery failures by platform and type, helping you identify and troubleshoot common issues.
* **Segment insights tab**: Provides detailed performance metrics for each audience segment in your push notification campaigns.
* **Events tab:** Tracks user interactions triggered by notifications, such as app opens or specific in-app actions. It provides conversion data and engagement insights, helping you evaluate the effectiveness of your push notifications in driving user activity.
### Performance tab
The **Performance** tab in the Pushwoosh **Message statistics** section provides key metrics to analyze the effectiveness of your push notification campaigns. It includes an overview of sent, delivered unique, and opened notifications, along with platform breakdowns and engagement trends.
#### Key performance metrics
* **SENT**: The total number of push notifications sent.
* **DELIVERED UNIQUE**: The number of unique recipients who successfully received the notification.
* **OPENED**: The number and percentage of delivered unique notifications that were opened by users.
* **ERRORS**: The number and percentage of messages that failed to deliver, broken down by platform and error type. Use this data to troubleshoot delivery problems and improve campaign reliability. [Learn more](/product/troubleshooting/sending-errors/)
Below the key metrics, the **Frequency capping** row shows how [frequency capping](/product/messaging-channels/global-frequency-capping) affected this message:
* **Suppressions**: the number of messages that were not sent because the recipient had already reached their frequency capping limit.
* **Affected users**: the number of unique users who had at least one message suppressed by frequency capping.
The graph visualizes each metric over time, allowing you to track trends and identify fluctuations in message delivery.
#### Platform breakdowns
For each metric, Pushwoosh allows you to analyze performance across different platforms:
* Total (all platforms combined)
* iOS
* Android
* Xiaomi
* Baidu, etc.
### Segment insights
**Segment insights** provides detailed performance metrics for each audience segment targeted in your push notification campaigns. By adding segments, you can track message performance, compare engagement metrics, and optimize your communication strategy.
#### How to add a segment
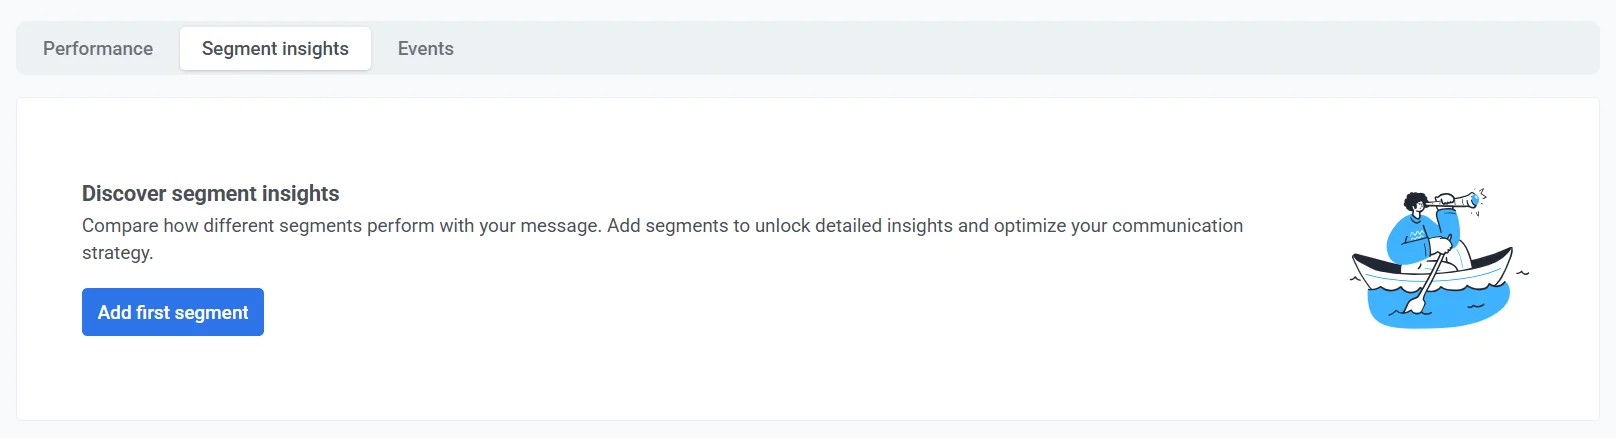
If no segments have been added yet, you will see the **Discover segment insights** screen. To start analyzing segment performance:
1. Click **Add first segment**.
2. In the **Add segment for insight** pop-up window:
* Use the dropdown menu to select a segment.
* Click **Add one more** to include additional segments for comparison.
3. Click **Apply** to confirm your selection.
#### Key metrics
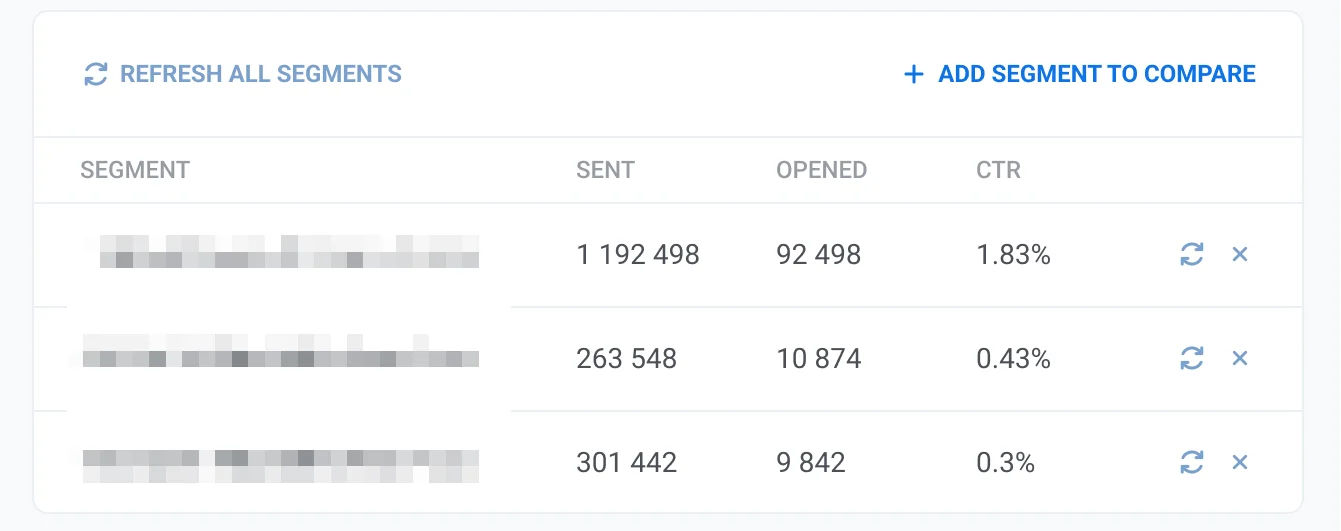
Each segment is displayed with the following performance metrics:
| | |
| ----- | ----- |
| **Sent** | The total number of push notifications sent to the segment. This helps measure the overall reach of your campaign. |
| **Opened** | The number of notifications that were opened by users in the segment, indicating user engagement with the message. |
| **CTR** | The percentage of opened notifications relative to the total sent. A higher CTR indicates strong engagement, while a low CTR may suggest adjustments in content or timing. |
#### Working with segment data
* **Refresh all segments**: Click this button to update the latest performance data for all listed segments.
* **Add segment to compare**: Compare performance across multiple segments to identify trends and optimize targeting.
* **Individual refresh button**: Update data for a specific segment without refreshing all segments.
* **Remove segment (✖️ icon)**: Delete a segment from the list if it's no longer needed.
### Events
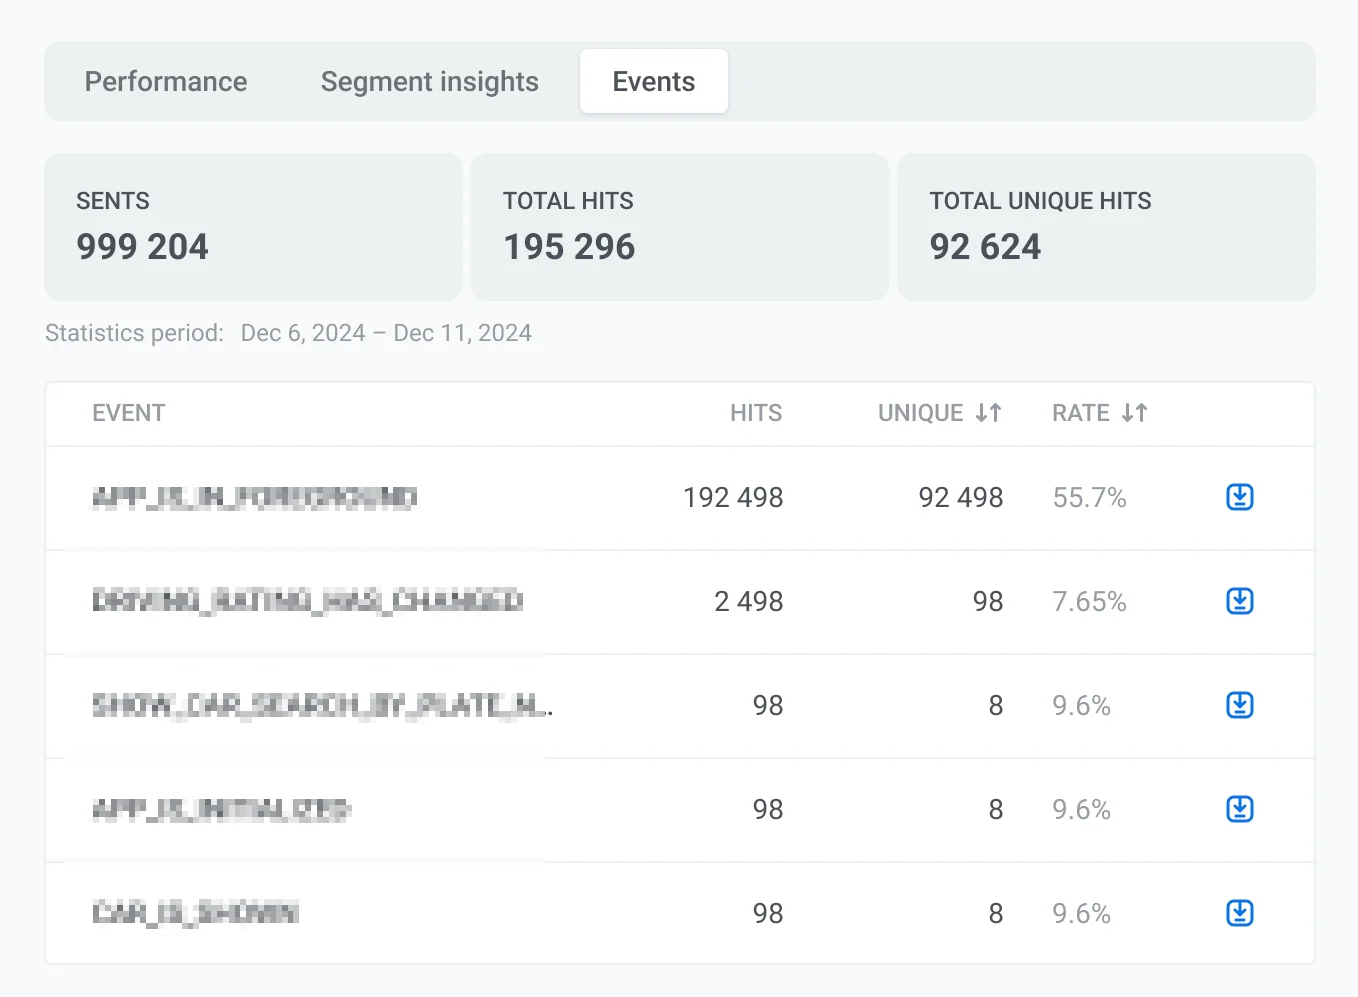
**Events** provide detailed insights into user interactions triggered by push notifications. It allows you to understand how users interact with your app after receiving a notification.
#### Key metrics
The **Events tab** displays the following metrics:
| | |
| :---- | ----- |
| **Sent** | The total number of push notifications sent. |
| **Total hits** | The total number of times tracked events were triggered by users who received the notification. |
| **Total unique hits** | The number of unique users who triggered an event at least once. |
#### Additional event details
For each event, you will also see the following metrics:
| | |
| ----- | ----- |
| **Hits** | The number of times an event was triggered across all users. |
| **Unique** | The number of unique users who triggered the event. |
| **Rate (%)** | The percentage of users who performed the event relative to total unique users. |
#### How event tracking works in Pushwoosh
Push notifications can be used to encourage users to perform various actions, such as adding items to a cart or submitting an order.
When a user performs a specific action in your application, a [`postEvent`](/developer/api-reference/user-centric-api#postevent) API method gets fired. Our backend registers the number of times this method was fired in the application. The process is the following:
1. You launch a campaign or send a push message.
2. A user receives a push notification and opens the message.
3. Within the next 24 hours, when a user performs any action in the app, Pushwoosh SDK fires a [`postEvent`](/developer/api-reference/user-centric-api#postevent) method containing the ID of that push notification the user has opened.
4. Our server tracks the number of [`postEvent`](/developer/api-reference/user-centric-api#postevent) calls, providing insights into user interactions after opening the push.
#### Exporting event reports
You can export event reports to analyze event hits and user interactions in detail. For this:
1. Click the **Export** icon next to the event name.
2. Once the export is complete, a notification will appear with a **Download CSV** button.
3. Click **Download CSV** to save the report to your device.

### Content
The **Content** section provides details about the push notification, including its message, delivery status, and targeting parameters. It helps you review the notification's content and key properties at a glance.
Here you can find:
#### Notification preview
At the top, you can see the push notification as it appeared to recipients.
Clicking **Open preset** allows you to view or edit the preset configuration.
#### Message details
Additional details about the message include:
* **Message ID** – A unique identifier assigned to the notification.
* **Message code** – A reference code used for tracking or API interactions.
* **Source** – Indicates whether the notification was sent via API, control panel, or another method.
* **Languages** – Lists the languages in which the message was sent.
#### Delivery information and targeting parameters
This section also contains key information about when and how the message was sent:
* **Status** indicates whether the message was successfully sent (`DONE`) or is still processing.
* **Sent date** shows the exact date and time of delivery.
* **Scheduling options** specify whether the message was sent at an optimal time or a predefined schedule.
* **Target segment** displays the audience that received the message.
* **Target platforms** list the operating systems the notification was delivered to, such as iOS, Android, or Windows.
Clicking **Show all properties** expands the section to display further metadata related to the notification.
### Managing push statistics and recipient data
#### Pick a date range
By default, if no custom range is selected, the **Message statistics** section adjusts its data display based on the specific time frame of each metric.
To view statistics for a specific period:
1. Click **Pick date range**.
2. Select your desired start and end dates
3. Click **Apply.**
#### Find a specific recipient
Use the **Find recipient** option to search for a specific user within the campaign.
For this:
1. In the **Performance** tab, click the **three-dot menu**.
2. Select **Find recipient** from the dropdown menu.
3. Search the recipient by [HWID](/product/pushwoosh-knowledge-hub/device-identifiers/#hwid) or [UserID](/product/pushwoosh-knowledge-hub/users-userids/)
#### Export recipients list
You can download detailed data about the recipients of your push campaign. This data can be used for further analysis or segmentation to optimize future campaigns.
To export the recipients list:
1. Click the **three-dot menu (⋮)** at the top of the **Message Statistics** page or next to a specific metric.
2. From the dropdown menu, select **Export recipients list**.
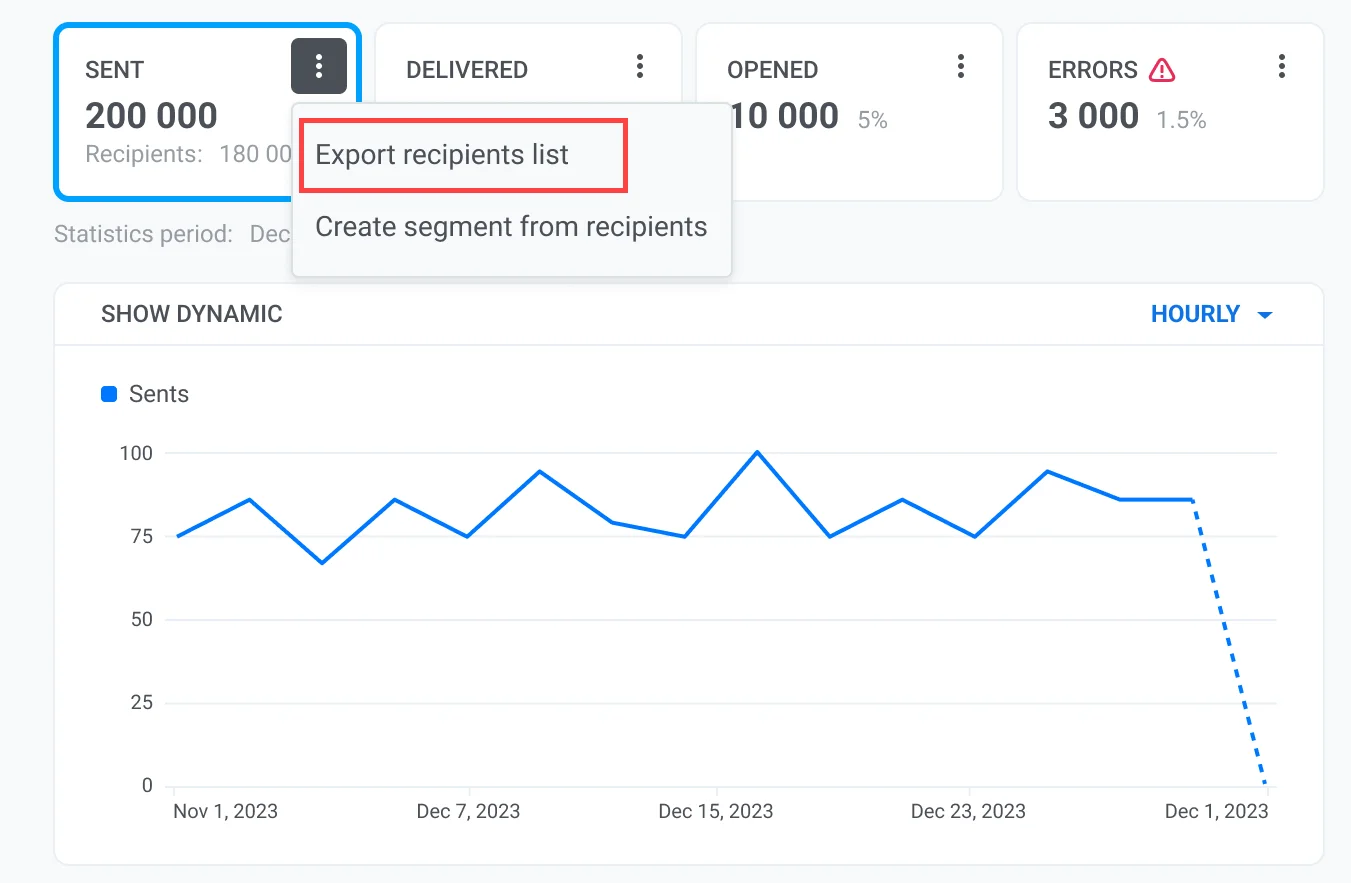
3. When the export is complete, a notification will appear with a **Download CSV** button. Click the button to download the recipient data in CSV format.
#### Create a segment from recipients
Also, you can create a segment directly from the recipients of a sent message. This allows targeting users who have already engaged with your communications, enabling more refined audience segmentation for future campaigns.
To create a segment:
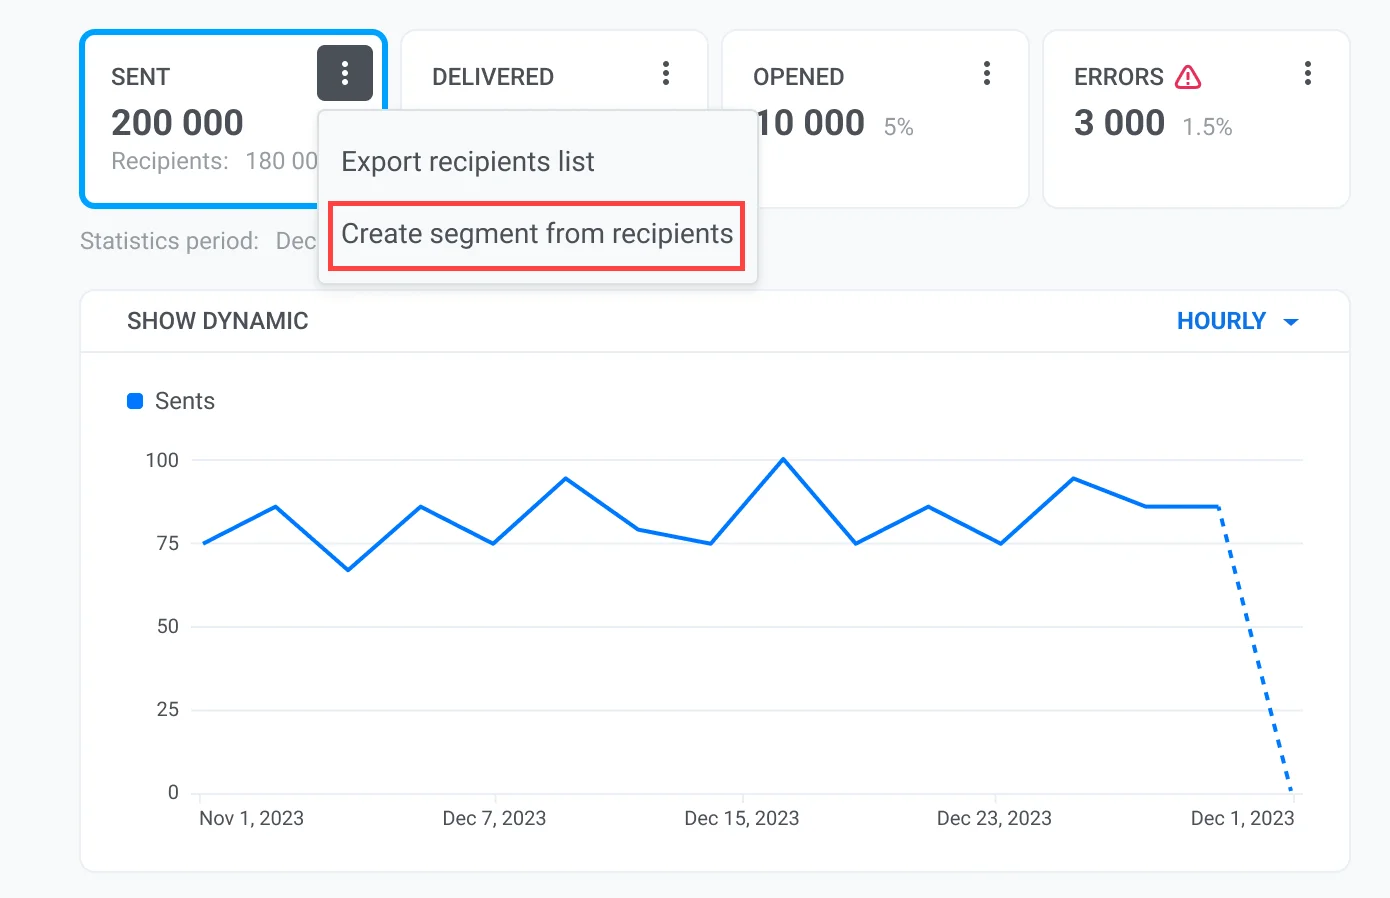
1. Click the **three-dot menu (⋮)** next to the relevant metric.
2. In the dropdown menu, select **Create segment from recipients**.
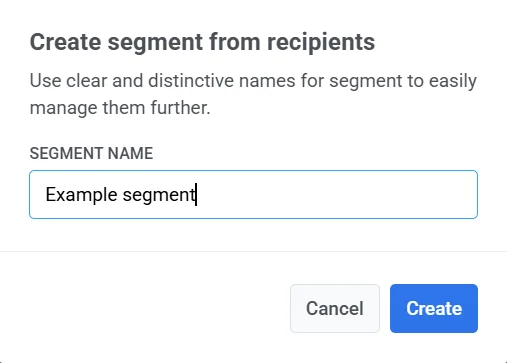
3. In the pop-up window, enter a **Segment name**. Choose a clear and descriptive name for easy identification (e.g., *Active Users*, *Engaged Customers*).
4. Click **Create** to save the segment.
Your new segment will be available for use in future campaigns, allowing you to tailor your messaging to specific audience groups.
## Understand the overall performance of push notifications
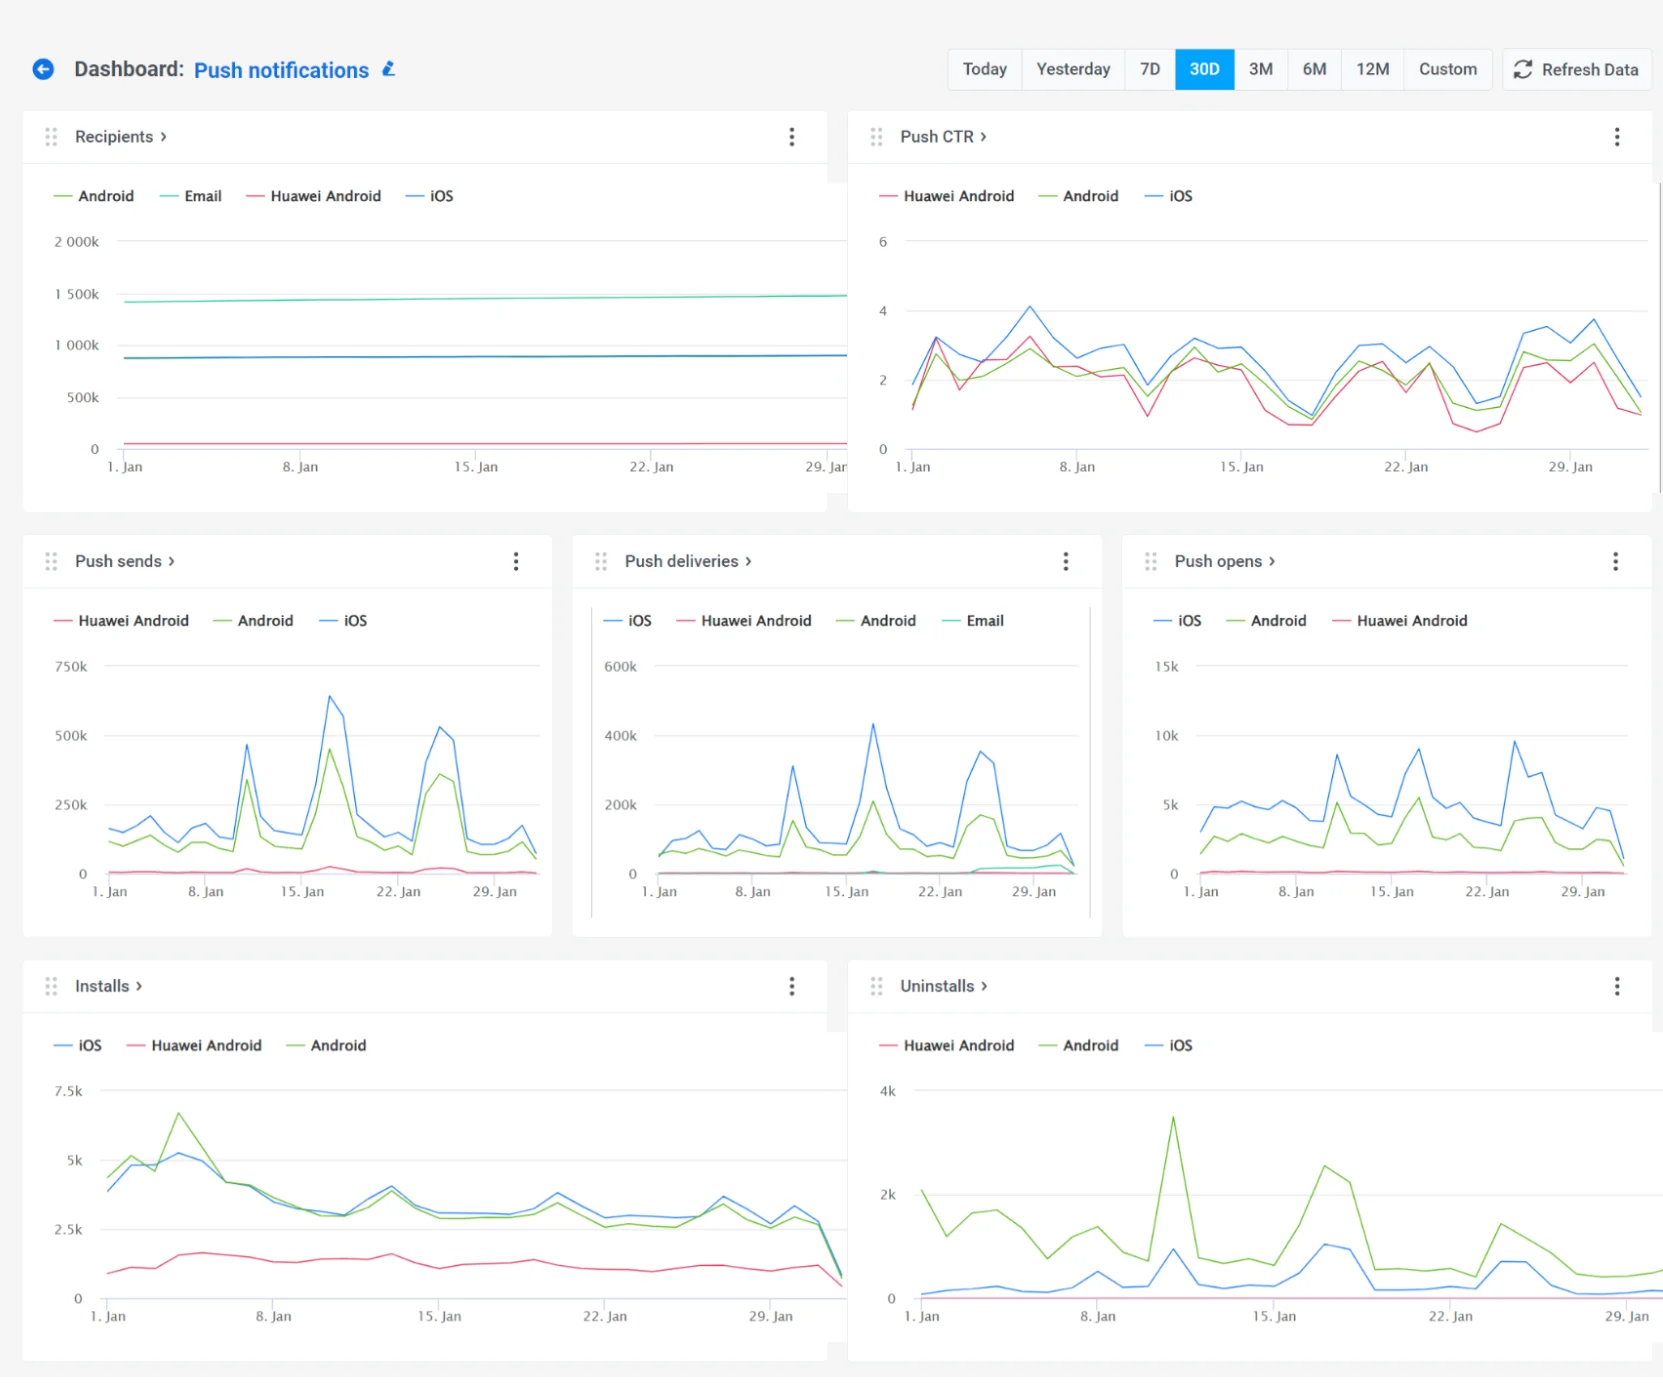
You can view overall push notification analytics in the Dashboards section to assess trends in engagement and reach.
For this, navigate to **Statistics > Dashboards > Push notifications**
The dashboard provides comprehensive insights into the overall performance of push notifications, featuring metrics like:
* Recipients
* Push CTR
* Push sends
* Push deliveries
* Push opens
* Installs
* Uninstalls
Also, you can customize the dashboard to fit your needs by adding or removing specific metrics, or create a custom dashboard entirely tailored to your campaigns. [Learn more](/product/statistics-and-analytics/dashboards/metrics/)
## Push notification analytics FAQ
### What push notification analytics does Pushwoosh provide?
Pushwoosh provides analytics at multiple levels, including individual message, campaign, and overall trends in the push channel performance. It tracks key metrics such as open rate, CTR, and post-notification user behavior to help you understand how your push notifications perform across various audiences and platforms.
### What key performance metrics can I track for push notifications?
Pushwoosh lets you monitor essential metrics like the number of messages sent, delivered to unique recipients, and opened, along with click-through rates (CTR). It also tracks cases where messages couldn't be delivered, helping you optimize delivery performance.
### Can I export my push notification analytics data?
Yes. Pushwoosh allows you to export campaign analytics data, including recipient lists and user interaction reports, in CSV format.
### How can I analyze push performance across different user segments?
Use the **Segment insights** tab to compare metrics across audience segments. You can add multiple segments, refresh their data, and remove any if needed.
### How do push notification analytics impact campaign optimization?
Push notification analytics give you actionable insights into user behavior. By identifying high-performing content, drop-off points, and engagement patterns, you can A/B test more effectively, adjust timing, and refine your targeting, all of which lead to better engagement and higher conversion rates.
## Additional resources
- [Push analytics dashboard](/product/statistics-and-analytics/dashboards/managing-dashboards/#preconfigured-dashboards)
- [Push notification benchmarks (from Pushwoosh 2025 study)](https://www.pushwoosh.com/blog/push-notification-benchmarks/)
- [How to increase push notifications CTR](https://www.pushwoosh.com/blog/increase-push-notifications-ctr/)
- [From guesswork to experimentation: Increase your ROI with push notification A/B/n testing](https://www.pushwoosh.com/blog/push-notification-a-b-testing/)
 ## View detailed push notification statistics
To access detailed statistics for a push notification, follow these steps:
1. **Via One-time messages:**
* Navigate to **Campaigns > One-time messages**.
* Select the message you want to analyze.
* Click on the message to open the statistics window.
2. **For notifications in a Journey:**
* Open the **Journey** canvas.
* Select the **Push** element within the Journey.
* Click **Detailed statistics** to view performance insights.

## Push message stats overview
The **Message statistics** section is divided into several tabs, each providing different insights into your push notification campaigns:
* **Performance tab:** Displays key performance metrics, including **SENT**, **DELIVERED UNIQUE**, **OPENED**, and **ERRORS**. The tab includes dynamic graphs to track trends over time and a platform breakdown so you can analyze performance across different operating systems. The **ERRORS** metric highlights delivery failures by platform and type, helping you identify and troubleshoot common issues.
* **Segment insights tab**: Provides detailed performance metrics for each audience segment in your push notification campaigns.
* **Events tab:** Tracks user interactions triggered by notifications, such as app opens or specific in-app actions. It provides conversion data and engagement insights, helping you evaluate the effectiveness of your push notifications in driving user activity.
### Performance tab
The **Performance** tab in the Pushwoosh **Message statistics** section provides key metrics to analyze the effectiveness of your push notification campaigns. It includes an overview of sent, delivered unique, and opened notifications, along with platform breakdowns and engagement trends.

#### Key performance metrics
* **SENT**: The total number of push notifications sent.
* **DELIVERED UNIQUE**: The number of unique recipients who successfully received the notification.
* **OPENED**: The number and percentage of delivered unique notifications that were opened by users.
* **ERRORS**: The number and percentage of messages that failed to deliver, broken down by platform and error type. Use this data to troubleshoot delivery problems and improve campaign reliability. [Learn more](/product/troubleshooting/sending-errors/)
Below the key metrics, the **Frequency capping** row shows how [frequency capping](/product/messaging-channels/global-frequency-capping) affected this message:
* **Suppressions**: the number of messages that were not sent because the recipient had already reached their frequency capping limit.
* **Affected users**: the number of unique users who had at least one message suppressed by frequency capping.
The graph visualizes each metric over time, allowing you to track trends and identify fluctuations in message delivery.
#### Platform breakdowns
For each metric, Pushwoosh allows you to analyze performance across different platforms:
* Total (all platforms combined)
* iOS
* Android
* Xiaomi
* Baidu, etc.
### Segment insights
**Segment insights** provides detailed performance metrics for each audience segment targeted in your push notification campaigns. By adding segments, you can track message performance, compare engagement metrics, and optimize your communication strategy.
#### How to add a segment
If no segments have been added yet, you will see the **Discover segment insights** screen. To start analyzing segment performance:
1. Click **Add first segment**.

2. In the **Add segment for insight** pop-up window:
* Use the dropdown menu to select a segment.
* Click **Add one more** to include additional segments for comparison.
3. Click **Apply** to confirm your selection.
#### Key metrics
Each segment is displayed with the following performance metrics:
| | |
| ----- | ----- |
| **Sent** | The total number of push notifications sent to the segment. This helps measure the overall reach of your campaign. |
| **Opened** | The number of notifications that were opened by users in the segment, indicating user engagement with the message. |
| **CTR** | The percentage of opened notifications relative to the total sent. A higher CTR indicates strong engagement, while a low CTR may suggest adjustments in content or timing. |

#### Working with segment data
* **Refresh all segments**: Click this button to update the latest performance data for all listed segments.
* **Add segment to compare**: Compare performance across multiple segments to identify trends and optimize targeting.
* **Individual refresh button**: Update data for a specific segment without refreshing all segments.
* **Remove segment (✖️ icon)**: Delete a segment from the list if it's no longer needed.
### Events
**Events** provide detailed insights into user interactions triggered by push notifications. It allows you to understand how users interact with your app after receiving a notification.

#### Key metrics
The **Events tab** displays the following metrics:
| | |
| :---- | ----- |
| **Sent** | The total number of push notifications sent. |
| **Total hits** | The total number of times tracked events were triggered by users who received the notification. |
| **Total unique hits** | The number of unique users who triggered an event at least once. |
#### Additional event details
For each event, you will also see the following metrics:
| | |
| ----- | ----- |
| **Hits** | The number of times an event was triggered across all users. |
| **Unique** | The number of unique users who triggered the event. |
| **Rate (%)** | The percentage of users who performed the event relative to total unique users. |
#### How event tracking works in Pushwoosh
Push notifications can be used to encourage users to perform various actions, such as adding items to a cart or submitting an order.
When a user performs a specific action in your application, a [`postEvent`](/developer/api-reference/user-centric-api#postevent) API method gets fired. Our backend registers the number of times this method was fired in the application. The process is the following:
1. You launch a campaign or send a push message.
2. A user receives a push notification and opens the message.
3. Within the next 24 hours, when a user performs any action in the app, Pushwoosh SDK fires a [`postEvent`](/developer/api-reference/user-centric-api#postevent) method containing the ID of that push notification the user has opened.
4. Our server tracks the number of [`postEvent`](/developer/api-reference/user-centric-api#postevent) calls, providing insights into user interactions after opening the push.
#### Exporting event reports
You can export event reports to analyze event hits and user interactions in detail. For this:
1. Click the **Export** icon next to the event name.
2. Once the export is complete, a notification will appear with a **Download CSV** button.
3. Click **Download CSV** to save the report to your device.

### Content
The **Content** section provides details about the push notification, including its message, delivery status, and targeting parameters. It helps you review the notification's content and key properties at a glance.
Here you can find:
#### Notification preview
At the top, you can see the push notification as it appeared to recipients.
Clicking **Open preset** allows you to view or edit the preset configuration.
#### Message details
Additional details about the message include:
* **Message ID** – A unique identifier assigned to the notification.
* **Message code** – A reference code used for tracking or API interactions.
* **Source** – Indicates whether the notification was sent via API, control panel, or another method.
* **Languages** – Lists the languages in which the message was sent.
#### Delivery information and targeting parameters
This section also contains key information about when and how the message was sent:
* **Status** indicates whether the message was successfully sent (`DONE`) or is still processing.
* **Sent date** shows the exact date and time of delivery.
* **Scheduling options** specify whether the message was sent at an optimal time or a predefined schedule.
* **Target segment** displays the audience that received the message.
* **Target platforms** list the operating systems the notification was delivered to, such as iOS, Android, or Windows.
Clicking **Show all properties** expands the section to display further metadata related to the notification.
### Managing push statistics and recipient data
#### Pick a date range
By default, if no custom range is selected, the **Message statistics** section adjusts its data display based on the specific time frame of each metric.
To view statistics for a specific period:
1. Click **Pick date range**.
2. Select your desired start and end dates
3. Click **Apply.**
#### Find a specific recipient
Use the **Find recipient** option to search for a specific user within the campaign.
For this:
1. In the **Performance** tab, click the **three-dot menu**.
2. Select **Find recipient** from the dropdown menu.
3. Search the recipient by [HWID](/product/pushwoosh-knowledge-hub/device-identifiers/#hwid) or [UserID](/product/pushwoosh-knowledge-hub/users-userids/)
#### Export recipients list
You can download detailed data about the recipients of your push campaign. This data can be used for further analysis or segmentation to optimize future campaigns.
To export the recipients list:
1. Click the **three-dot menu (⋮)** at the top of the **Message Statistics** page or next to a specific metric.
2. From the dropdown menu, select **Export recipients list**.

3. When the export is complete, a notification will appear with a **Download CSV** button. Click the button to download the recipient data in CSV format.
#### Create a segment from recipients
Also, you can create a segment directly from the recipients of a sent message. This allows targeting users who have already engaged with your communications, enabling more refined audience segmentation for future campaigns.
To create a segment:
1. Click the **three-dot menu (⋮)** next to the relevant metric.
2. In the dropdown menu, select **Create segment from recipients**.

3. In the pop-up window, enter a **Segment name**. Choose a clear and descriptive name for easy identification (e.g., *Active Users*, *Engaged Customers*).
4. Click **Create** to save the segment.

Your new segment will be available for use in future campaigns, allowing you to tailor your messaging to specific audience groups.
## Understand the overall performance of push notifications
You can view overall push notification analytics in the Dashboards section to assess trends in engagement and reach.
For this, navigate to **Statistics > Dashboards > Push notifications**
The dashboard provides comprehensive insights into the overall performance of push notifications, featuring metrics like:
* Recipients
* Push CTR
* Push sends
* Push deliveries
* Push opens
* Installs
* Uninstalls
## View detailed push notification statistics
To access detailed statistics for a push notification, follow these steps:
1. **Via One-time messages:**
* Navigate to **Campaigns > One-time messages**.
* Select the message you want to analyze.
* Click on the message to open the statistics window.
2. **For notifications in a Journey:**
* Open the **Journey** canvas.
* Select the **Push** element within the Journey.
* Click **Detailed statistics** to view performance insights.

## Push message stats overview
The **Message statistics** section is divided into several tabs, each providing different insights into your push notification campaigns:
* **Performance tab:** Displays key performance metrics, including **SENT**, **DELIVERED UNIQUE**, **OPENED**, and **ERRORS**. The tab includes dynamic graphs to track trends over time and a platform breakdown so you can analyze performance across different operating systems. The **ERRORS** metric highlights delivery failures by platform and type, helping you identify and troubleshoot common issues.
* **Segment insights tab**: Provides detailed performance metrics for each audience segment in your push notification campaigns.
* **Events tab:** Tracks user interactions triggered by notifications, such as app opens or specific in-app actions. It provides conversion data and engagement insights, helping you evaluate the effectiveness of your push notifications in driving user activity.
### Performance tab
The **Performance** tab in the Pushwoosh **Message statistics** section provides key metrics to analyze the effectiveness of your push notification campaigns. It includes an overview of sent, delivered unique, and opened notifications, along with platform breakdowns and engagement trends.

#### Key performance metrics
* **SENT**: The total number of push notifications sent.
* **DELIVERED UNIQUE**: The number of unique recipients who successfully received the notification.
* **OPENED**: The number and percentage of delivered unique notifications that were opened by users.
* **ERRORS**: The number and percentage of messages that failed to deliver, broken down by platform and error type. Use this data to troubleshoot delivery problems and improve campaign reliability. [Learn more](/product/troubleshooting/sending-errors/)
Below the key metrics, the **Frequency capping** row shows how [frequency capping](/product/messaging-channels/global-frequency-capping) affected this message:
* **Suppressions**: the number of messages that were not sent because the recipient had already reached their frequency capping limit.
* **Affected users**: the number of unique users who had at least one message suppressed by frequency capping.
The graph visualizes each metric over time, allowing you to track trends and identify fluctuations in message delivery.
#### Platform breakdowns
For each metric, Pushwoosh allows you to analyze performance across different platforms:
* Total (all platforms combined)
* iOS
* Android
* Xiaomi
* Baidu, etc.
### Segment insights
**Segment insights** provides detailed performance metrics for each audience segment targeted in your push notification campaigns. By adding segments, you can track message performance, compare engagement metrics, and optimize your communication strategy.
#### How to add a segment
If no segments have been added yet, you will see the **Discover segment insights** screen. To start analyzing segment performance:
1. Click **Add first segment**.

2. In the **Add segment for insight** pop-up window:
* Use the dropdown menu to select a segment.
* Click **Add one more** to include additional segments for comparison.
3. Click **Apply** to confirm your selection.
#### Key metrics
Each segment is displayed with the following performance metrics:
| | |
| ----- | ----- |
| **Sent** | The total number of push notifications sent to the segment. This helps measure the overall reach of your campaign. |
| **Opened** | The number of notifications that were opened by users in the segment, indicating user engagement with the message. |
| **CTR** | The percentage of opened notifications relative to the total sent. A higher CTR indicates strong engagement, while a low CTR may suggest adjustments in content or timing. |

#### Working with segment data
* **Refresh all segments**: Click this button to update the latest performance data for all listed segments.
* **Add segment to compare**: Compare performance across multiple segments to identify trends and optimize targeting.
* **Individual refresh button**: Update data for a specific segment without refreshing all segments.
* **Remove segment (✖️ icon)**: Delete a segment from the list if it's no longer needed.
### Events
**Events** provide detailed insights into user interactions triggered by push notifications. It allows you to understand how users interact with your app after receiving a notification.

#### Key metrics
The **Events tab** displays the following metrics:
| | |
| :---- | ----- |
| **Sent** | The total number of push notifications sent. |
| **Total hits** | The total number of times tracked events were triggered by users who received the notification. |
| **Total unique hits** | The number of unique users who triggered an event at least once. |
#### Additional event details
For each event, you will also see the following metrics:
| | |
| ----- | ----- |
| **Hits** | The number of times an event was triggered across all users. |
| **Unique** | The number of unique users who triggered the event. |
| **Rate (%)** | The percentage of users who performed the event relative to total unique users. |
#### How event tracking works in Pushwoosh
Push notifications can be used to encourage users to perform various actions, such as adding items to a cart or submitting an order.
When a user performs a specific action in your application, a [`postEvent`](/developer/api-reference/user-centric-api#postevent) API method gets fired. Our backend registers the number of times this method was fired in the application. The process is the following:
1. You launch a campaign or send a push message.
2. A user receives a push notification and opens the message.
3. Within the next 24 hours, when a user performs any action in the app, Pushwoosh SDK fires a [`postEvent`](/developer/api-reference/user-centric-api#postevent) method containing the ID of that push notification the user has opened.
4. Our server tracks the number of [`postEvent`](/developer/api-reference/user-centric-api#postevent) calls, providing insights into user interactions after opening the push.
#### Exporting event reports
You can export event reports to analyze event hits and user interactions in detail. For this:
1. Click the **Export** icon next to the event name.
2. Once the export is complete, a notification will appear with a **Download CSV** button.
3. Click **Download CSV** to save the report to your device.

### Content
The **Content** section provides details about the push notification, including its message, delivery status, and targeting parameters. It helps you review the notification's content and key properties at a glance.
Here you can find:
#### Notification preview
At the top, you can see the push notification as it appeared to recipients.
Clicking **Open preset** allows you to view or edit the preset configuration.
#### Message details
Additional details about the message include:
* **Message ID** – A unique identifier assigned to the notification.
* **Message code** – A reference code used for tracking or API interactions.
* **Source** – Indicates whether the notification was sent via API, control panel, or another method.
* **Languages** – Lists the languages in which the message was sent.
#### Delivery information and targeting parameters
This section also contains key information about when and how the message was sent:
* **Status** indicates whether the message was successfully sent (`DONE`) or is still processing.
* **Sent date** shows the exact date and time of delivery.
* **Scheduling options** specify whether the message was sent at an optimal time or a predefined schedule.
* **Target segment** displays the audience that received the message.
* **Target platforms** list the operating systems the notification was delivered to, such as iOS, Android, or Windows.
Clicking **Show all properties** expands the section to display further metadata related to the notification.
### Managing push statistics and recipient data
#### Pick a date range
By default, if no custom range is selected, the **Message statistics** section adjusts its data display based on the specific time frame of each metric.
To view statistics for a specific period:
1. Click **Pick date range**.
2. Select your desired start and end dates
3. Click **Apply.**
#### Find a specific recipient
Use the **Find recipient** option to search for a specific user within the campaign.
For this:
1. In the **Performance** tab, click the **three-dot menu**.
2. Select **Find recipient** from the dropdown menu.
3. Search the recipient by [HWID](/product/pushwoosh-knowledge-hub/device-identifiers/#hwid) or [UserID](/product/pushwoosh-knowledge-hub/users-userids/)
#### Export recipients list
You can download detailed data about the recipients of your push campaign. This data can be used for further analysis or segmentation to optimize future campaigns.
To export the recipients list:
1. Click the **three-dot menu (⋮)** at the top of the **Message Statistics** page or next to a specific metric.
2. From the dropdown menu, select **Export recipients list**.

3. When the export is complete, a notification will appear with a **Download CSV** button. Click the button to download the recipient data in CSV format.
#### Create a segment from recipients
Also, you can create a segment directly from the recipients of a sent message. This allows targeting users who have already engaged with your communications, enabling more refined audience segmentation for future campaigns.
To create a segment:
1. Click the **three-dot menu (⋮)** next to the relevant metric.
2. In the dropdown menu, select **Create segment from recipients**.

3. In the pop-up window, enter a **Segment name**. Choose a clear and descriptive name for easy identification (e.g., *Active Users*, *Engaged Customers*).
4. Click **Create** to save the segment.

Your new segment will be available for use in future campaigns, allowing you to tailor your messaging to specific audience groups.
## Understand the overall performance of push notifications
You can view overall push notification analytics in the Dashboards section to assess trends in engagement and reach.
For this, navigate to **Statistics > Dashboards > Push notifications**
The dashboard provides comprehensive insights into the overall performance of push notifications, featuring metrics like:
* Recipients
* Push CTR
* Push sends
* Push deliveries
* Push opens
* Installs
* Uninstalls
 Also, you can customize the dashboard to fit your needs by adding or removing specific metrics, or create a custom dashboard entirely tailored to your campaigns. [Learn more](/product/statistics-and-analytics/dashboards/metrics/)
## Push notification analytics FAQ
### What push notification analytics does Pushwoosh provide?
Pushwoosh provides analytics at multiple levels, including individual message, campaign, and overall trends in the push channel performance. It tracks key metrics such as open rate, CTR, and post-notification user behavior to help you understand how your push notifications perform across various audiences and platforms.
### What key performance metrics can I track for push notifications?
Pushwoosh lets you monitor essential metrics like the number of messages sent, delivered to unique recipients, and opened, along with click-through rates (CTR). It also tracks cases where messages couldn't be delivered, helping you optimize delivery performance.
### Can I export my push notification analytics data?
Yes. Pushwoosh allows you to export campaign analytics data, including recipient lists and user interaction reports, in CSV format.
### How can I analyze push performance across different user segments?
Use the **Segment insights** tab to compare metrics across audience segments. You can add multiple segments, refresh their data, and remove any if needed.
### How do push notification analytics impact campaign optimization?
Push notification analytics give you actionable insights into user behavior. By identifying high-performing content, drop-off points, and engagement patterns, you can A/B test more effectively, adjust timing, and refine your targeting, all of which lead to better engagement and higher conversion rates.
## Additional resources
- [Push analytics dashboard](/product/statistics-and-analytics/dashboards/managing-dashboards/#preconfigured-dashboards)
- [Push notification benchmarks (from Pushwoosh 2025 study)](https://www.pushwoosh.com/blog/push-notification-benchmarks/)
- [How to increase push notifications CTR](https://www.pushwoosh.com/blog/increase-push-notifications-ctr/)
- [From guesswork to experimentation: Increase your ROI with push notification A/B/n testing](https://www.pushwoosh.com/blog/push-notification-a-b-testing/)
Also, you can customize the dashboard to fit your needs by adding or removing specific metrics, or create a custom dashboard entirely tailored to your campaigns. [Learn more](/product/statistics-and-analytics/dashboards/metrics/)
## Push notification analytics FAQ
### What push notification analytics does Pushwoosh provide?
Pushwoosh provides analytics at multiple levels, including individual message, campaign, and overall trends in the push channel performance. It tracks key metrics such as open rate, CTR, and post-notification user behavior to help you understand how your push notifications perform across various audiences and platforms.
### What key performance metrics can I track for push notifications?
Pushwoosh lets you monitor essential metrics like the number of messages sent, delivered to unique recipients, and opened, along with click-through rates (CTR). It also tracks cases where messages couldn't be delivered, helping you optimize delivery performance.
### Can I export my push notification analytics data?
Yes. Pushwoosh allows you to export campaign analytics data, including recipient lists and user interaction reports, in CSV format.
### How can I analyze push performance across different user segments?
Use the **Segment insights** tab to compare metrics across audience segments. You can add multiple segments, refresh their data, and remove any if needed.
### How do push notification analytics impact campaign optimization?
Push notification analytics give you actionable insights into user behavior. By identifying high-performing content, drop-off points, and engagement patterns, you can A/B test more effectively, adjust timing, and refine your targeting, all of which lead to better engagement and higher conversion rates.
## Additional resources
- [Push analytics dashboard](/product/statistics-and-analytics/dashboards/managing-dashboards/#preconfigured-dashboards)
- [Push notification benchmarks (from Pushwoosh 2025 study)](https://www.pushwoosh.com/blog/push-notification-benchmarks/)
- [How to increase push notifications CTR](https://www.pushwoosh.com/blog/increase-push-notifications-ctr/)
- [From guesswork to experimentation: Increase your ROI with push notification A/B/n testing](https://www.pushwoosh.com/blog/push-notification-a-b-testing/)