# In-app statistics
Pushwoosh provides in-app analytics at both the individual message and overall campaign level, giving you deep insights into channel performance.
## Track individual in-app message performance directly from the Journey canvas
You can monitor the performance of each in-app message within a customer journey directly on the **Journey canvas**.
To view the statistics for a message, you can either enable **Show Metrics** at the bottom of the canvas or hover over the element to see the metrics.
This will show the following data for an in-app message:
| | |
|-------------------|----------------------------------------------------------------------------------------------------------------------|
| **Goals Reached** | Indicates the number of users who reached the Conversion Goal at that specific point. |
| **Drop-offs** | Represents the number of messages that couldn't be sent, such as when a user's push token has expired. |
For deeper in-app analytics, double-click on the in-app element. Then, in the window that appears, click on the name of the Rich Media. This action will open up comprehensive statistics for the message.
Once the page opens, specify the timeframe for data tracking and select the platform. You can also decide whether the data will be displayed daily, hourly, weekly, or monthly.
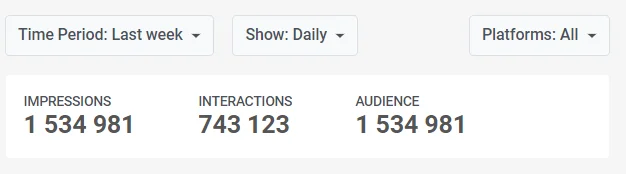
At the top of the page, you'll find a summary of the most important in-app performance metrics:
* **Impressions:** The number of times the in-app was displayed to users during the selected period.
* **Unique Impressions:** The number of unique users who were shown the in-app message during the selected period.
* **Interactions:** This metric reflects the number of times users engaged with the in-app message, such as button clicks or link taps.
* **Unique Interactions:** The number of unique users who interacted with the in-app message during the selected period.
* **Audience:** The list of active user devices on which the in-app was displayed.
### Key Metrics tab
The **Key Metrics** tab provides a visual representation of the most important metrics that reveal the performance of your in-app message. On each graph, you can select a specific time period and examine it in more detail.
* **Impressions:** Hover over the graph to view the number of times users were exposed to your in-app message during the selected period.
* **Interactions:** Navigate to the **Interactions** graph to understand how users engaged with the in-app elements. For a more granular breakdown of interactions by individual elements, visit the Interactions tab or click **Show interactions**.
* **Impression Duration:** Hover over the graph to see how long users viewed your in-app message. This graph segments users based on their impression sessions.
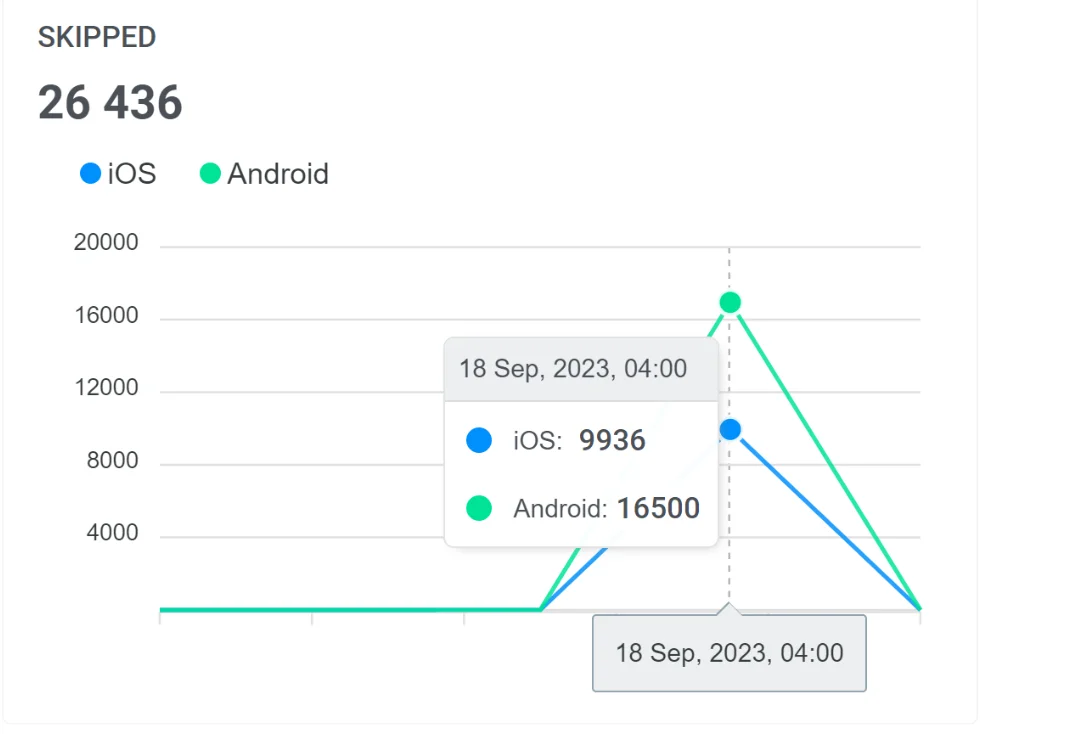
* **Skipped In-Apps:** Hover over the **Skipped** graph to identify the number of users who closed the in-app without interacting with it.
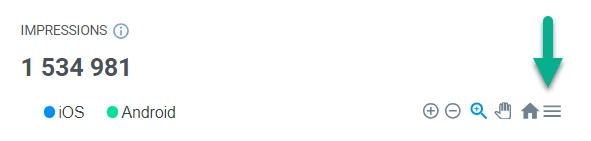
You can download all graphs in SVG or PNG formats for further analysis and presentation. To do so, simply click on the **Menu** icon located near each graph.
### Interactions tab
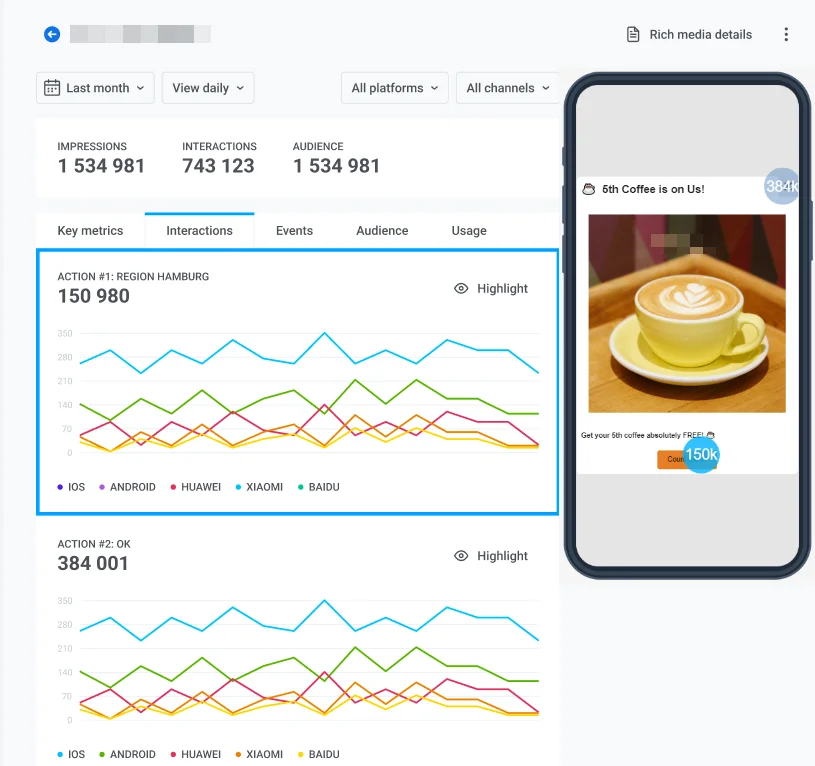
The **Interactions** tab allows you to dive deeper into user interactions. This tab highlights the most frequently interacted-with elements, such as close or action buttons.
### Events tab
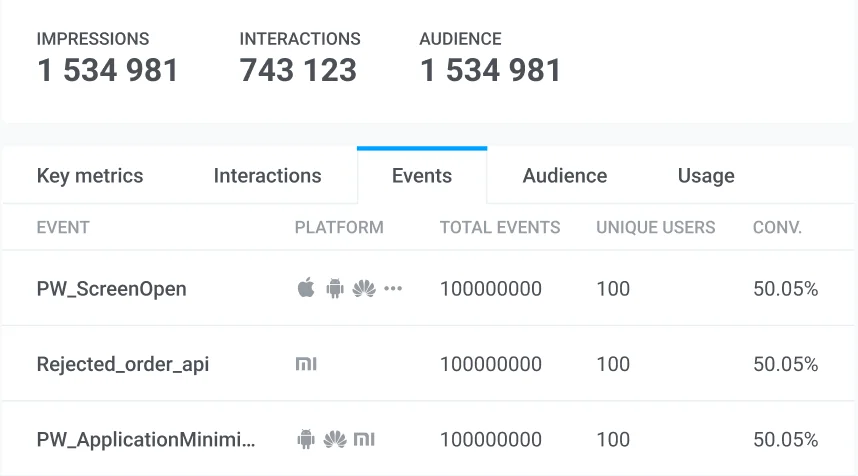
The **Events** tab displays data for each event that can be triggered when interacting with the in-app, including event name, platform, the total number of events triggered, and the number of unique users.
### Audience tab
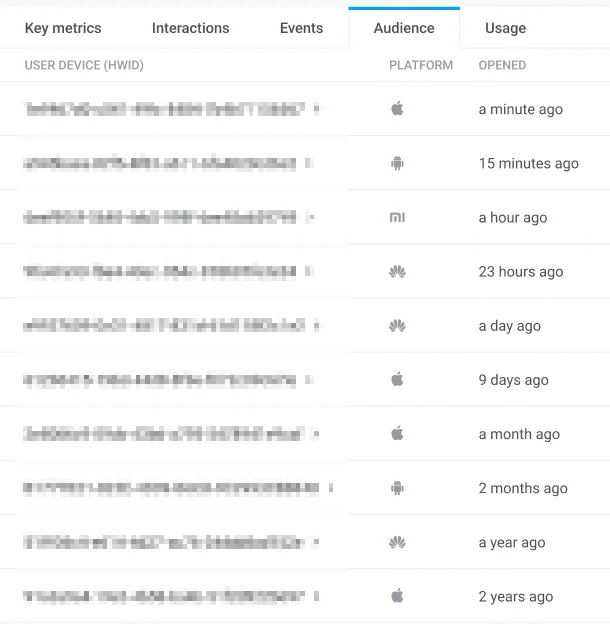
The **Audience** tab reveals your in-app message recipients and provides a list of active user devices on which the in-app was displayed. Click on the **HWID** to view user details.
### Usage tab
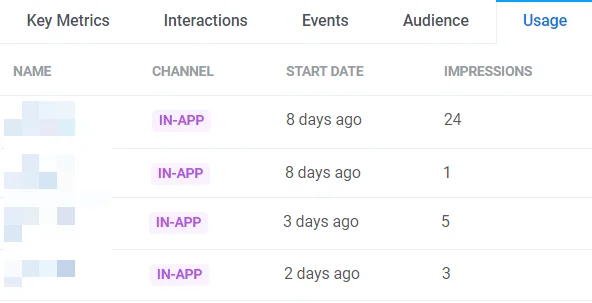
The **Usage** tab shows the start date of the in-app and the total number of impressions.
## Understand overall in-app messaging performance trends
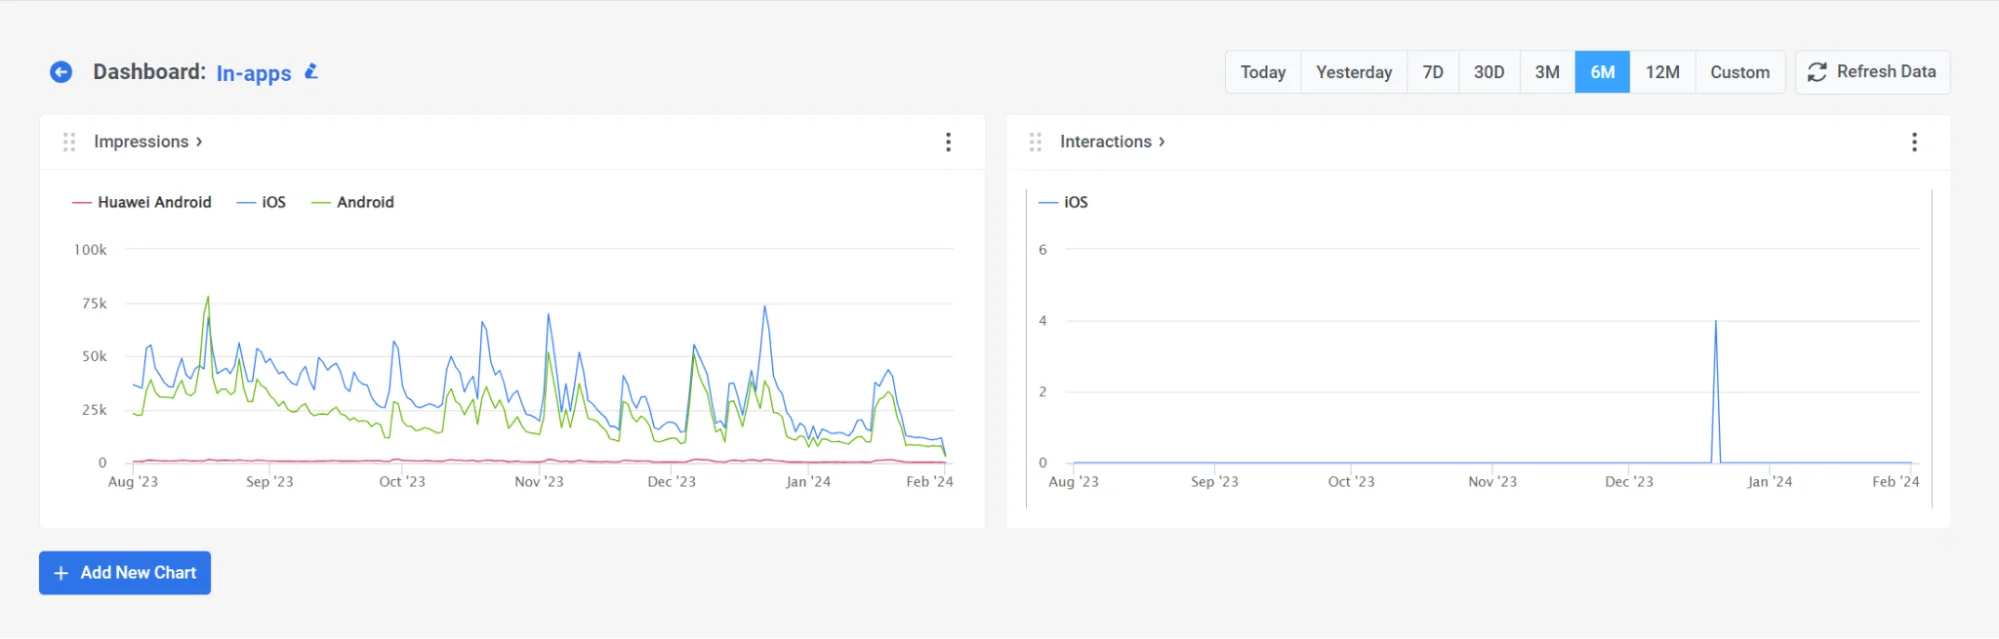
You can use the pre-built **In-app dashboard** to evaluate the overall performance of your in-app campaigns. For this, navigate to **Statistics > Dashboards > In-apps.**
The dashboard provides insights into overall performance of your in-apps, featuring metrics like in-app Impressions and Interactions.
Also, you can customize the dashboard to fit your needs by adding or removing specific metrics, or create a custom dashboard entirely tailored to your campaigns. [Learn more](/product/statistics-and-analytics/dashboards/)
## In-app analytics FAQ
#### How can I view analytics for a specific in-app message?
You can open statistics from the **Content** → **In-apps (Rich media)** list by clicking the template name, or from the Journey canvas by enabling **Show Metrics** or double-clicking the in-app element and clicking the Rich Media name. The statistics page shows impressions, interactions, and audience data.
#### Where can I view overall campaign-level in-app analytics?
Visit the **In-app Dashboard** under **Statistics > Dashboards > In-apps** for a complete overview of your in-app messaging performance.
#### Can I export my in-app analytics data?
Yes. You can download charts in SVG or PNG and access detailed metrics per message and across campaigns.
 ### Key Metrics tab
The **Key Metrics** tab provides a visual representation of the most important metrics that reveal the performance of your in-app message. On each graph, you can select a specific time period and examine it in more detail.
* **Impressions:** Hover over the graph to view the number of times users were exposed to your in-app message during the selected period.
### Key Metrics tab
The **Key Metrics** tab provides a visual representation of the most important metrics that reveal the performance of your in-app message. On each graph, you can select a specific time period and examine it in more detail.
* **Impressions:** Hover over the graph to view the number of times users were exposed to your in-app message during the selected period.
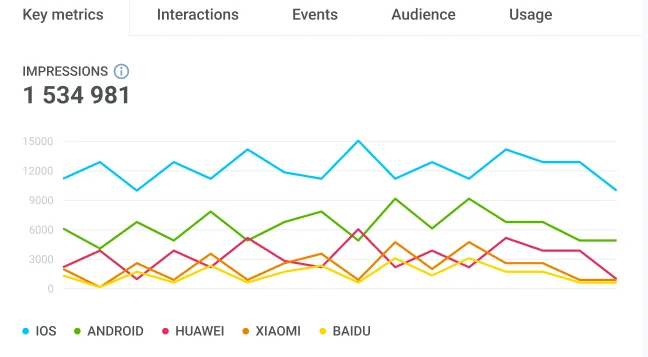 * **Interactions:** Navigate to the **Interactions** graph to understand how users engaged with the in-app elements. For a more granular breakdown of interactions by individual elements, visit the Interactions tab or click **Show interactions**.
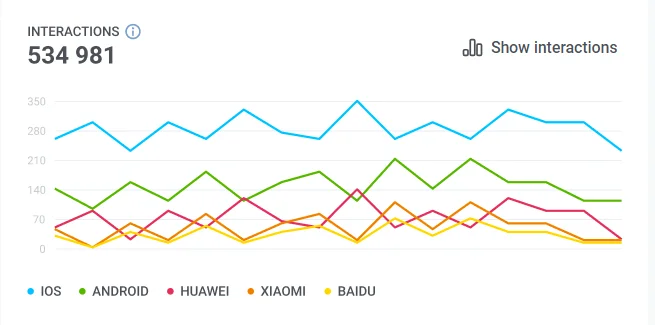 * **Impression Duration:** Hover over the graph to see how long users viewed your in-app message. This graph segments users based on their impression sessions.
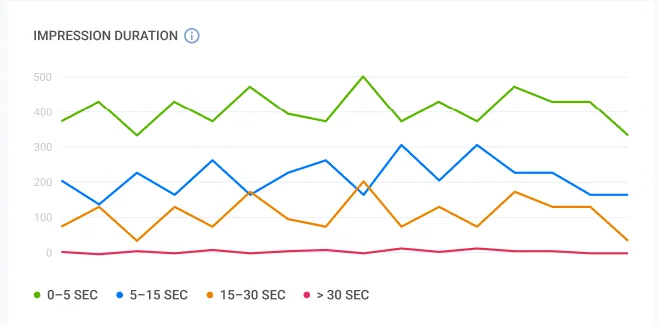 * **Skipped In-Apps:** Hover over the **Skipped** graph to identify the number of users who closed the in-app without interacting with it.
 You can download all graphs in SVG or PNG formats for further analysis and presentation. To do so, simply click on the **Menu** icon located near each graph.
 ### Interactions tab
The **Interactions** tab allows you to dive deeper into user interactions. This tab highlights the most frequently interacted-with elements, such as close or action buttons.
### Interactions tab
The **Interactions** tab allows you to dive deeper into user interactions. This tab highlights the most frequently interacted-with elements, such as close or action buttons.
 ### Events tab
The **Events** tab displays data for each event that can be triggered when interacting with the in-app, including event name, platform, the total number of events triggered, and the number of unique users.
### Events tab
The **Events** tab displays data for each event that can be triggered when interacting with the in-app, including event name, platform, the total number of events triggered, and the number of unique users.
 ### Audience tab
The **Audience** tab reveals your in-app message recipients and provides a list of active user devices on which the in-app was displayed. Click on the **HWID** to view user details.
### Audience tab
The **Audience** tab reveals your in-app message recipients and provides a list of active user devices on which the in-app was displayed. Click on the **HWID** to view user details.
 ### Usage tab
The **Usage** tab shows the start date of the in-app and the total number of impressions.
### Usage tab
The **Usage** tab shows the start date of the in-app and the total number of impressions.
 ## Understand overall in-app messaging performance trends
You can use the pre-built **In-app dashboard** to evaluate the overall performance of your in-app campaigns. For this, navigate to **Statistics > Dashboards > In-apps.**
The dashboard provides insights into overall performance of your in-apps, featuring metrics like in-app Impressions and Interactions.
## Understand overall in-app messaging performance trends
You can use the pre-built **In-app dashboard** to evaluate the overall performance of your in-app campaigns. For this, navigate to **Statistics > Dashboards > In-apps.**
The dashboard provides insights into overall performance of your in-apps, featuring metrics like in-app Impressions and Interactions.
 Also, you can customize the dashboard to fit your needs by adding or removing specific metrics, or create a custom dashboard entirely tailored to your campaigns. [Learn more](/product/statistics-and-analytics/dashboards/)
## In-app analytics FAQ
#### How can I view analytics for a specific in-app message?
You can open statistics from the **Content** → **In-apps (Rich media)** list by clicking the template name, or from the Journey canvas by enabling **Show Metrics** or double-clicking the in-app element and clicking the Rich Media name. The statistics page shows impressions, interactions, and audience data.
#### Where can I view overall campaign-level in-app analytics?
Visit the **In-app Dashboard** under **Statistics > Dashboards > In-apps** for a complete overview of your in-app messaging performance.
#### Can I export my in-app analytics data?
Yes. You can download charts in SVG or PNG and access detailed metrics per message and across campaigns.
Also, you can customize the dashboard to fit your needs by adding or removing specific metrics, or create a custom dashboard entirely tailored to your campaigns. [Learn more](/product/statistics-and-analytics/dashboards/)
## In-app analytics FAQ
#### How can I view analytics for a specific in-app message?
You can open statistics from the **Content** → **In-apps (Rich media)** list by clicking the template name, or from the Journey canvas by enabling **Show Metrics** or double-clicking the in-app element and clicking the Rich Media name. The statistics page shows impressions, interactions, and audience data.
#### Where can I view overall campaign-level in-app analytics?
Visit the **In-app Dashboard** under **Statistics > Dashboards > In-apps** for a complete overview of your in-app messaging performance.
#### Can I export my in-app analytics data?
Yes. You can download charts in SVG or PNG and access detailed metrics per message and across campaigns.