# Overall journey statistics
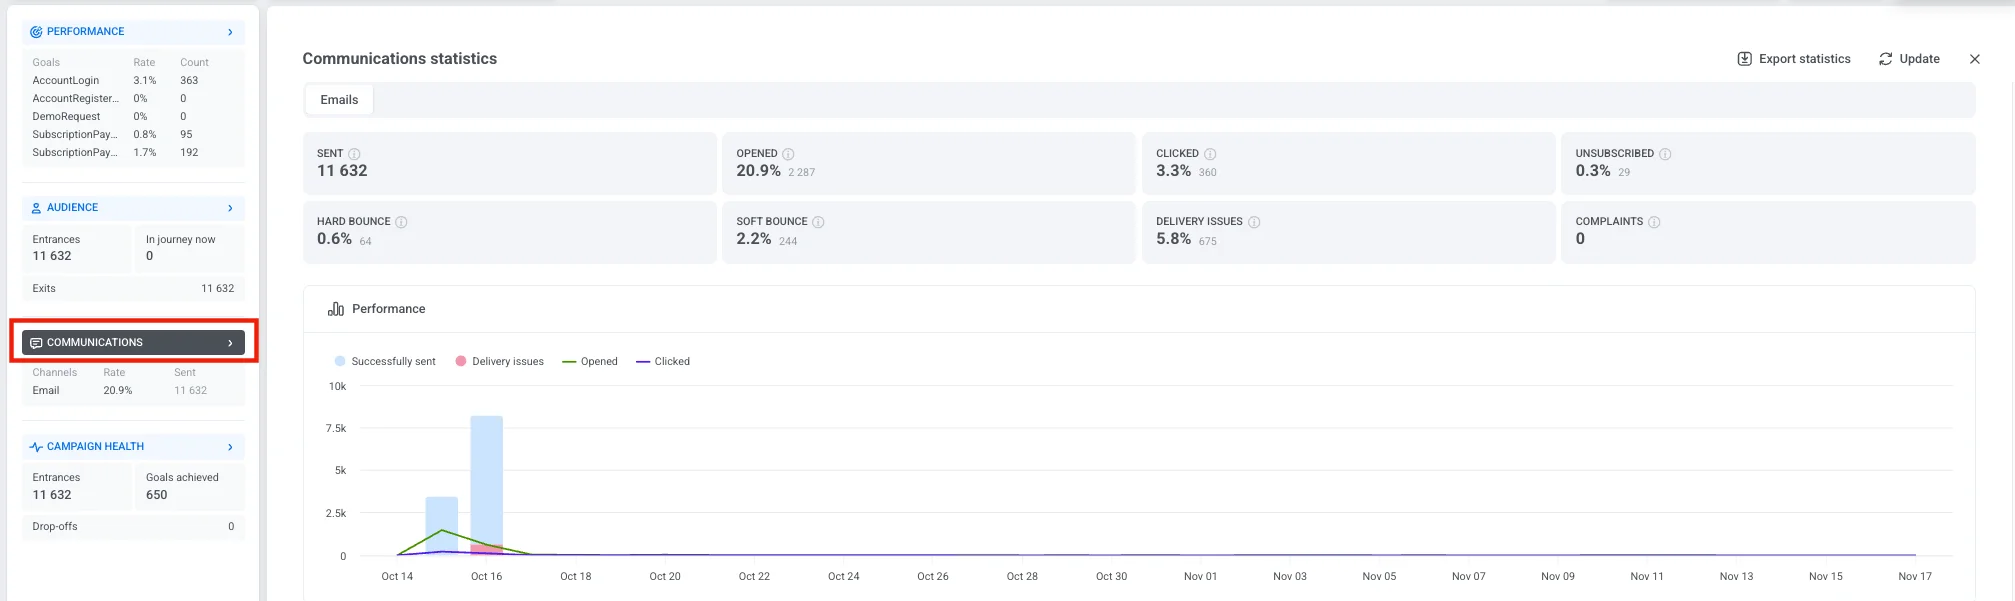
The **Journey statistics** section provides key performance data and insights for your Customer Journey campaigns. Use this section to track user engagement, goal completion, message delivery, and drop-off rates over time.
This section includes the following analytics dashboards:
* **Performance**: Shows the performance of each goal, including conversion counts and rates.
* **Audience**: Displays the number of users currently in the journey and those who have exited.
* **Communications**: Breaks down messages sent by channel (e.g., Push, Email, SMS, In-app, WhatsApp).
* **Campaign health**: A high-level summary of campaign activity, including total entrances, goals achieved, and drop-offs.
To view detailed stats for any dashboard, click a section name in the left panel.
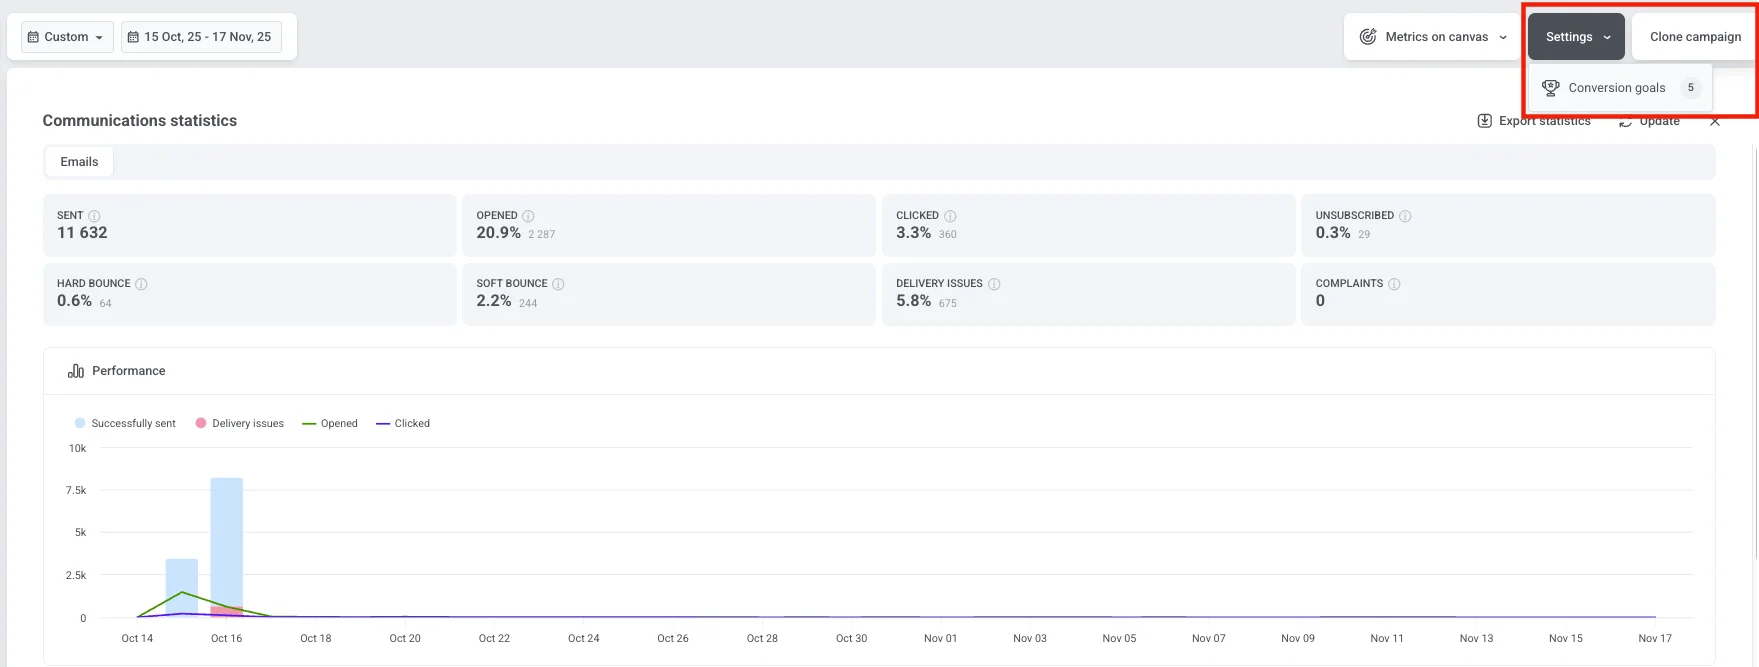
You can also view the number of conversion goals configured for your campaign. To see detailed information about each goal, click **Settings** and select **Conversion goals**.
##### Select a time period
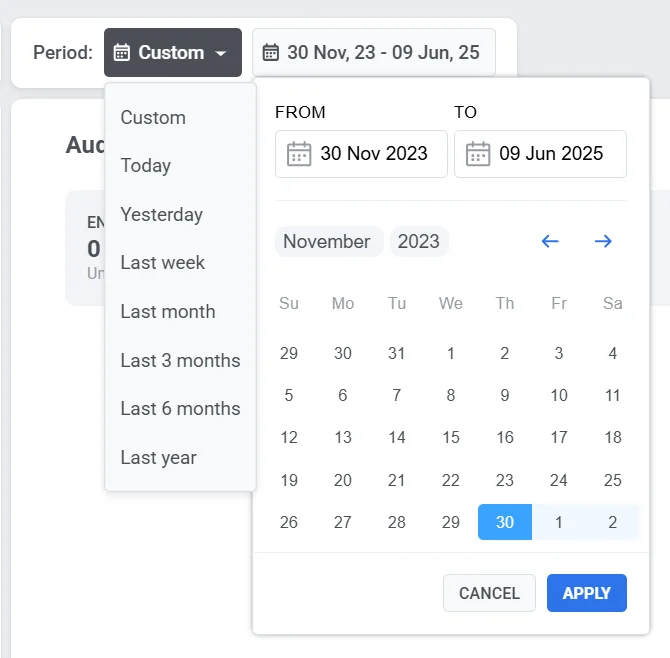
Use the **Period** filter at the top of the dashboard to analyze data for a specific time range.
By default, the dashboard displays overall statistics from the campaign launch to the present. To view data for a different timeframe, click the dropdown and choose from predefined options (e.g., Today, Yesterday, 7 Days, 30 Days), or set a custom date range.
##### Manage campaign status
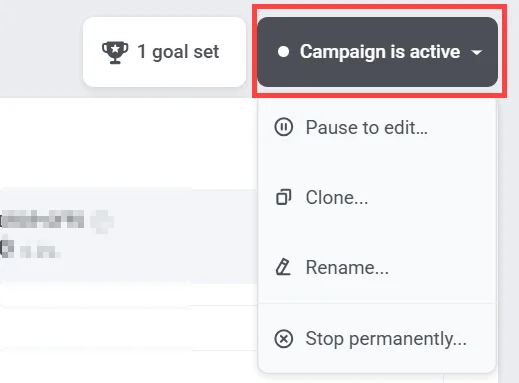
Use the **Campaign status** dropdown in the upper-right corner to manage the campaign. Available options include:
* **Pause to edit**
* **Clone**
* **Rename**
* **Stop permanently**. This action is irreversible.
## Performance
The Performance section shows how effectively your campaign achieves its goals. It helps you evaluate campaign success and identify areas for improvement.
Each goal is displayed with two key metrics:
* **Conversion rate (%)**: The percentage of users who achieved the goal relative to total campaign entrances.
* **Count**: The total number of users who completed the goal.
When you click the **Performance** section name in the left panel, the **Conversion Goals** window opens. This view provides detailed information about all goals configured for your journey, including their performance metrics and any defined conditions.
In this window, you can:
* Review conversion data for each goal.
* View goal conditions.
* See the conversion period, which shows how long conversions are tracked after a user exits the goal point (for example, *30 days after exit*).
* To save goal statistics, click **Download CSV** beside any goal to export its data as a CSV file.
## Audience
The **Audience** dashboard provides detailed information on how users interact with your campaign. It tracks user activity across the journey, including entries, exits, errors, and individual user statuses.
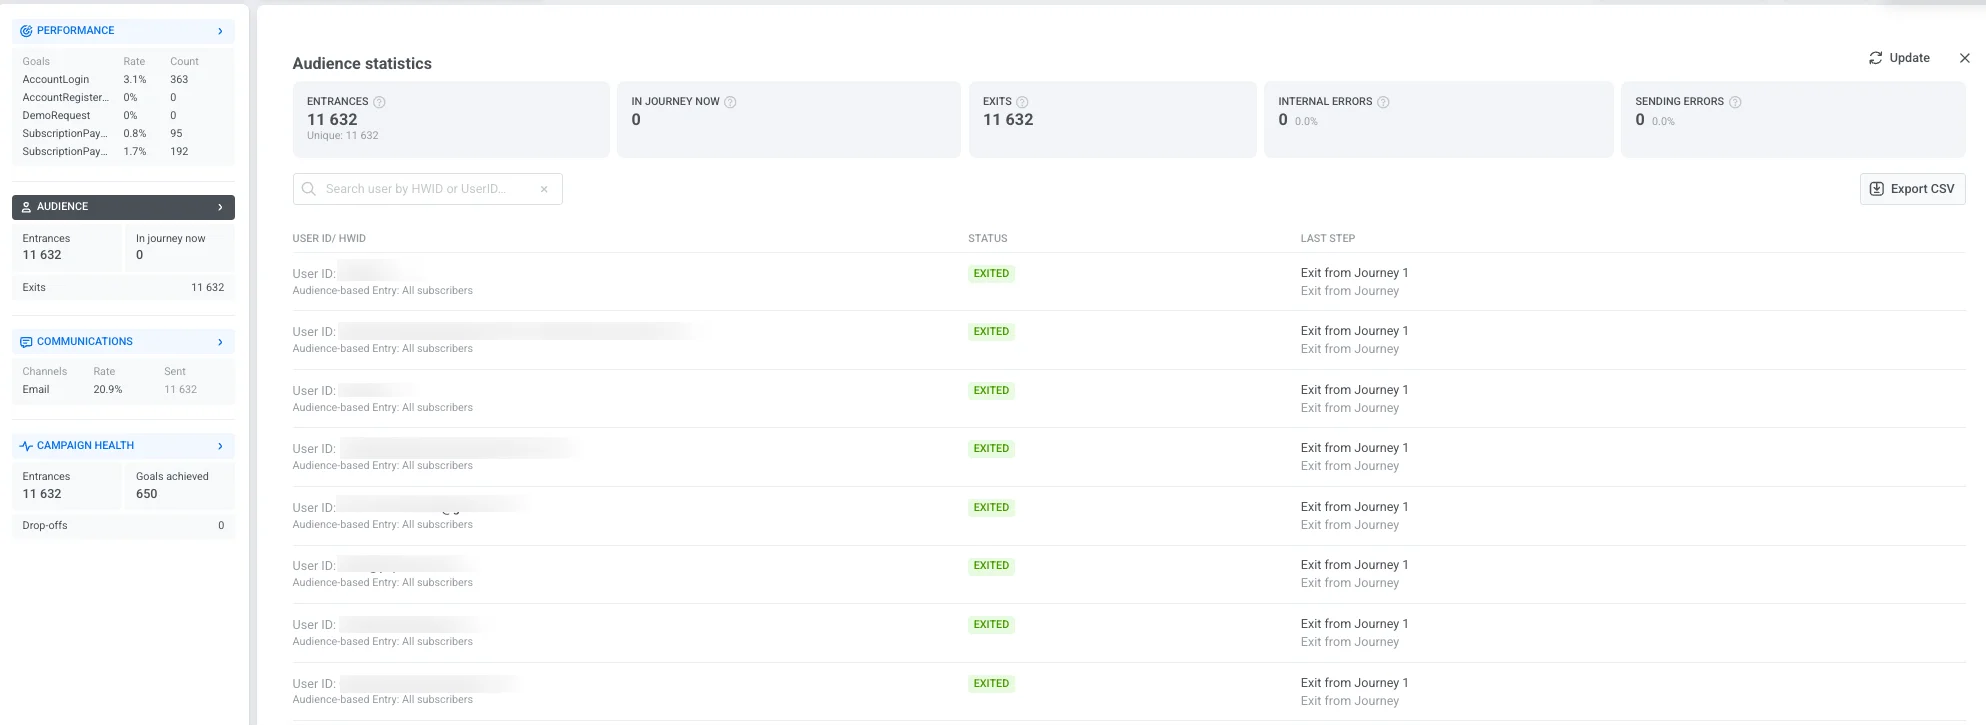
The dashboard includes the following key metrics:
| | |
| ------------------- | ---------------------------------------------------------------------------------------------------------------------------------------------------- |
| **Entrances** | Total number of users who entered the campaign during the selected time period, including repeat entries. |
| **In journey now** | Number of users currently active in the journey. |
| **Exits** | Number of users who have completed or exited the journey. |
| **Internal errors** | User drop-offs from the journey caused by technical issues. |
| **Sending errors** | Delivery failures caused by technical problems such as an uninstalled app, invalid email/phone, or a blocked gateway. |
The user list below displays individual journey records, helping you monitor specific cases and troubleshoot issues:
| | |
| ------------------ | ------------------------------------------------------------------------------------------------- |
| **User ID / HWID** | A unique identifier for each user. Use the search bar to find a specific user by HWID or User ID. |
| **Status** | Indicates the user's current state in the journey (e.g., *In Progress*, *Exited*, *Dropped off*). |
| **Last step** | Shows the last completed step or the point where the user exited the journey. If a user exited due to a [cancel event](/product/customer-journey/journey-settings/#remove-users-from-a-journey-without-counting-a-conversion), the column displays "Exit by Cancel event: [event name]" (e.g., "Exit by Cancel event: Cart Cleaned"). |
Click **Export CSV** to download the full list of user records and their statuses for further analysis.
## Communications
The **Communications** section provides detailed insights into how each messaging channel performs in your campaign. It helps you evaluate message delivery, engagement, and potential delivery issues so that you can optimize your communication strategy.
To open this view, click the **Communications** section name in the left panel. This opens the **Communications statistics** window where you can see how your messages are performing.
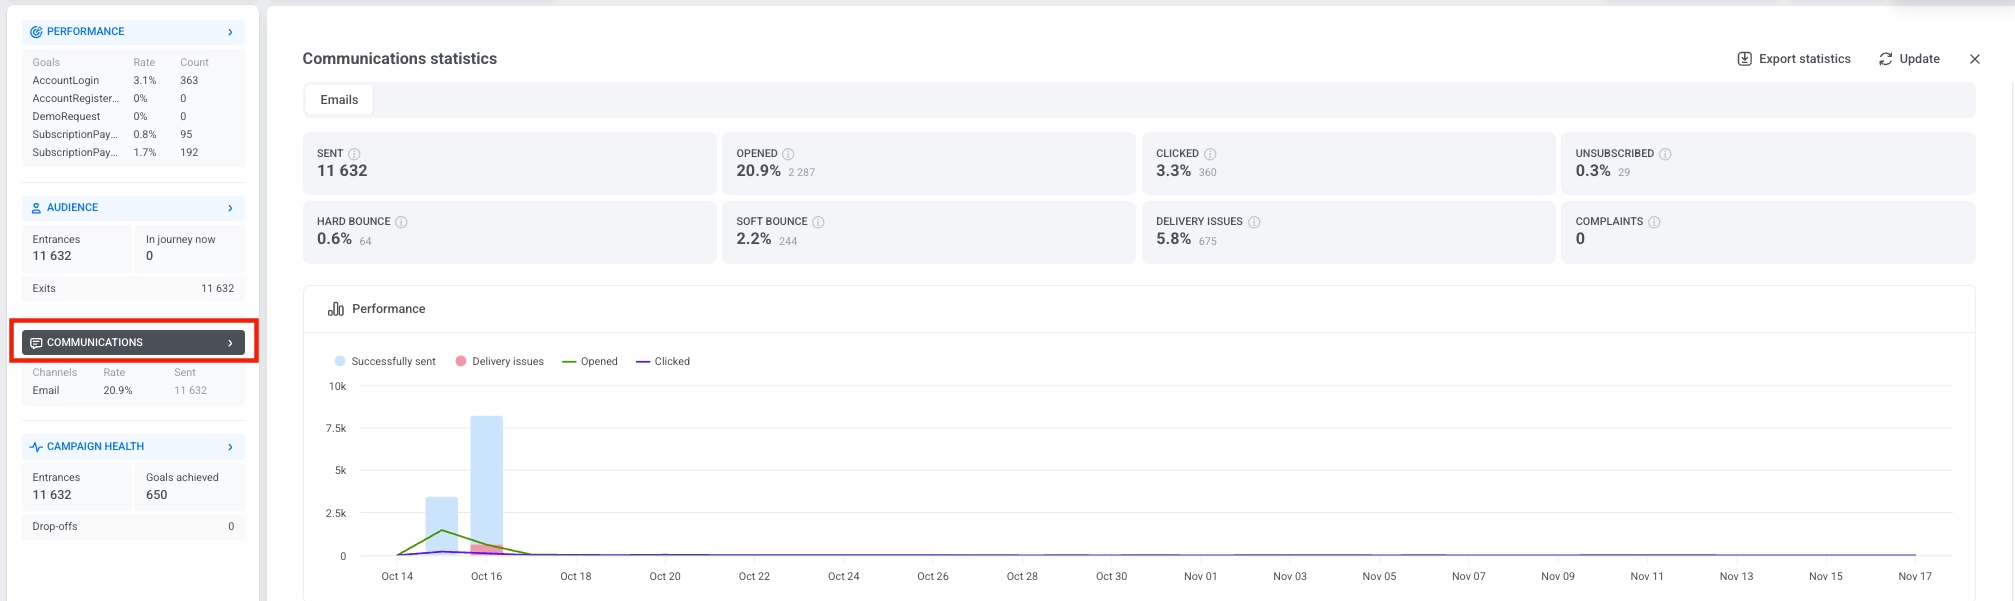
If your campaign includes multiple channels, separate tabs will be shown at the top of the window. Select a tab to switch between channels and review the metrics for each one.

### Metrics by channel
The metrics displayed in the Communications statistics window depend on the channel. Each channel tracks the statistics that are most relevant for that message type.
| Metric | What it measures |
| --- | --- |
| **Sent** | Total number of push notifications sent, including failed sending attempts. |
| **Recipients** | Push notifications Pushwoosh successfully sent out — Sent minus failed sends (for example, devices without a valid push token). Each user may have multiple devices, and each device counts as a separate recipient. |
| **Opened** | Number of unique message opens, shown as a percentage of Recipients. `Open rate = opens ÷ Recipients × 100%` |
| **Delivery issues** | Number of messages that could not be delivered, shown as a percentage of users who entered any push step in the journey. |
| Metric | What it measures |
| --- | --- |
| **Impressions** | Number of times in-app messages were displayed to users. |
| **Interactions** | Number of user interactions with in-app messages, shown as a percentage of Impressions. `Interaction rate = Interactions ÷ Impressions × 100%` |
| **Delivery issues** | Number of messages that could not be delivered, shown as a percentage of users who entered any in-app step in the journey. |
| Metric | What it measures |
| --- | --- |
| **Delivered** | Total number of successful email deliveries, including repeated deliveries to the same recipient. `Delivery rate = Delivered ÷ recipients × 100%` |
| **Unique delivered** | Number of unique users who had at least one message successfully delivered, shown as a count and as a percentage of recipients. `Unique delivery rate = unique deliveries ÷ recipients × 100%` |
| **Sent** | Total number of emails sent, including failed sending attempts. |
| **Opened unique** | Number of unique recipients who opened the message at least once, shown as a percentage of recipients. `Unique open rate = unique opens ÷ recipients × 100%` |
| **Clicked** | Number of recipients who clicked any link in the email, shown as a percentage of recipients. `Click rate = link clicks ÷ recipients × 100%` |
| **Unsubscribed** | Number of recipients who unsubscribed, shown as a percentage of recipients. `Unsubscribe rate = unsubscribes ÷ recipients × 100%` |
| **Hard bounce** | Number of emails not delivered due to permanent issues (e.g., invalid address), shown as a percentage of recipients. `Hard bounce rate = hard bounces ÷ recipients × 100%` |
| **Soft bounce** | Number of emails not delivered due to temporary issues (e.g., full inbox or server error), shown as a percentage of recipients. `Soft bounce rate = soft bounces ÷ recipients × 100%` |
| **Complaints** | Number of recipients who marked the email as spam, shown as a percentage of recipients. `Complaint rate = spam reports ÷ recipients × 100%` |
| **Delivery issues** | Number of messages that could not be delivered, shown as a percentage of users who entered any email step in the journey. |
| Metric | What it measures |
| --- | --- |
| **Sent** | Total number of SMS messages sent, including failed sending attempts. |
| **Delivered** | Number of messages successfully delivered, shown as a percentage of Sent. `Delivery rate = Delivered ÷ Sent × 100%` |
| **Delivery issues** | Number of messages that could not be delivered, shown as a percentage of users who entered any SMS step in the journey. |
| Metric | What it measures |
| --- | --- |
| **Sent** | Total number of WhatsApp messages sent, including failed sending attempts. |
| **Delivered** | Number of messages successfully delivered, shown as a percentage of recipients — WhatsApp messages successfully sent out (Sent minus failed sends). `Delivery rate = Delivered ÷ recipients × 100%` |
| **Read** | Number of messages read by users, shown as a percentage of recipients. `Read rate = Read ÷ recipients × 100%` |
| **Delivery issues** | Number of messages that could not be delivered, shown as a percentage of users who entered any WhatsApp step in the journey. |
### Frequency capping
Below the channel metrics, the **Frequency capping** row shows how [frequency capping](/product/messaging-channels/global-frequency-capping) affected this journey's messages over the selected period. It appears on the Push, Email, SMS, and WhatsApp tabs and displays two metrics:
* **Suppressions**: the number of messages that were not sent because the recipient had already reached their frequency capping limit.
* **Affected users**: the number of unique users who had at least one message suppressed by frequency capping.
The **Performance** chart visualizes message activity over time, helping you identify engagement trends and delivery patterns.

##### Message-level statistics
The **Messages** section below the Performance chart lists all communication steps for the selected communication channel. Use this table to compare how individual messages within this channel perform and to understand how each message contributes to your campaign goals.
At the top of the table, select a conversion goal to see how each message influences that specific goal. To download all message-level data, click **Export channel statistics** to export a CSV file for analysis or reporting.
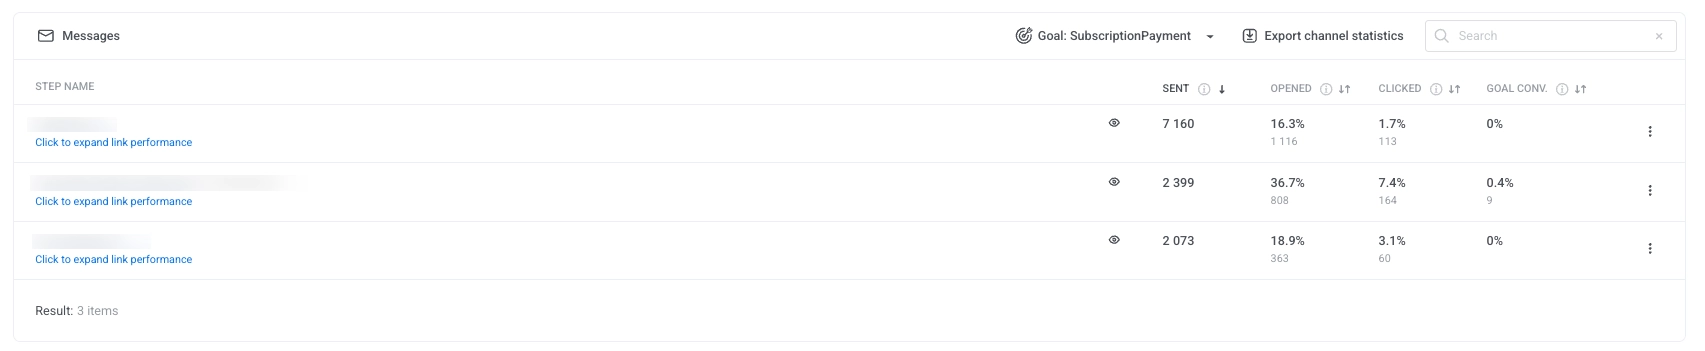
For each message, the table displays:
* **Sent**: The total number of messages sent.
* **Opened**: The percentage and number of users who opened the message.
* **Clicked**: The percentage and number of users who clicked on links.
* **Goal conversion**: The percentage and number of users who completed the selected conversion goal after interacting with the message.
To export data for an individual message, click the three dots menu next to the message name and choose one of the following options:
* **Export point statistics**: Downloads detailed performance metrics for that message.
* **Export point users**: Downloads a list of users who interacted with that message.
##### Delivery issues
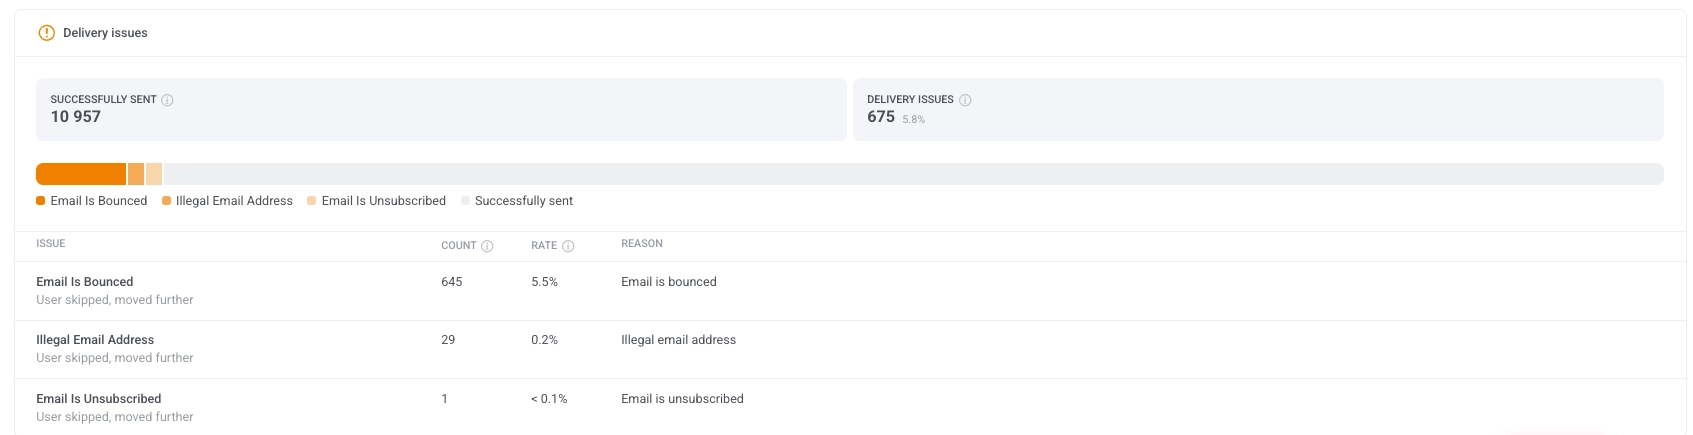
The **Delivery issues** section provides a detailed breakdown of failed or skipped message deliveries. It helps you identify and address common issues that may prevent messages from reaching users.
Each issue includes a count, rate, and reason, giving you transparency into delivery reliability.
## Campaign health
The **Campaign health** dashboard provides a high-level summary of your campaign's performance, helping you quickly evaluate user engagement, message delivery, and goal progression.
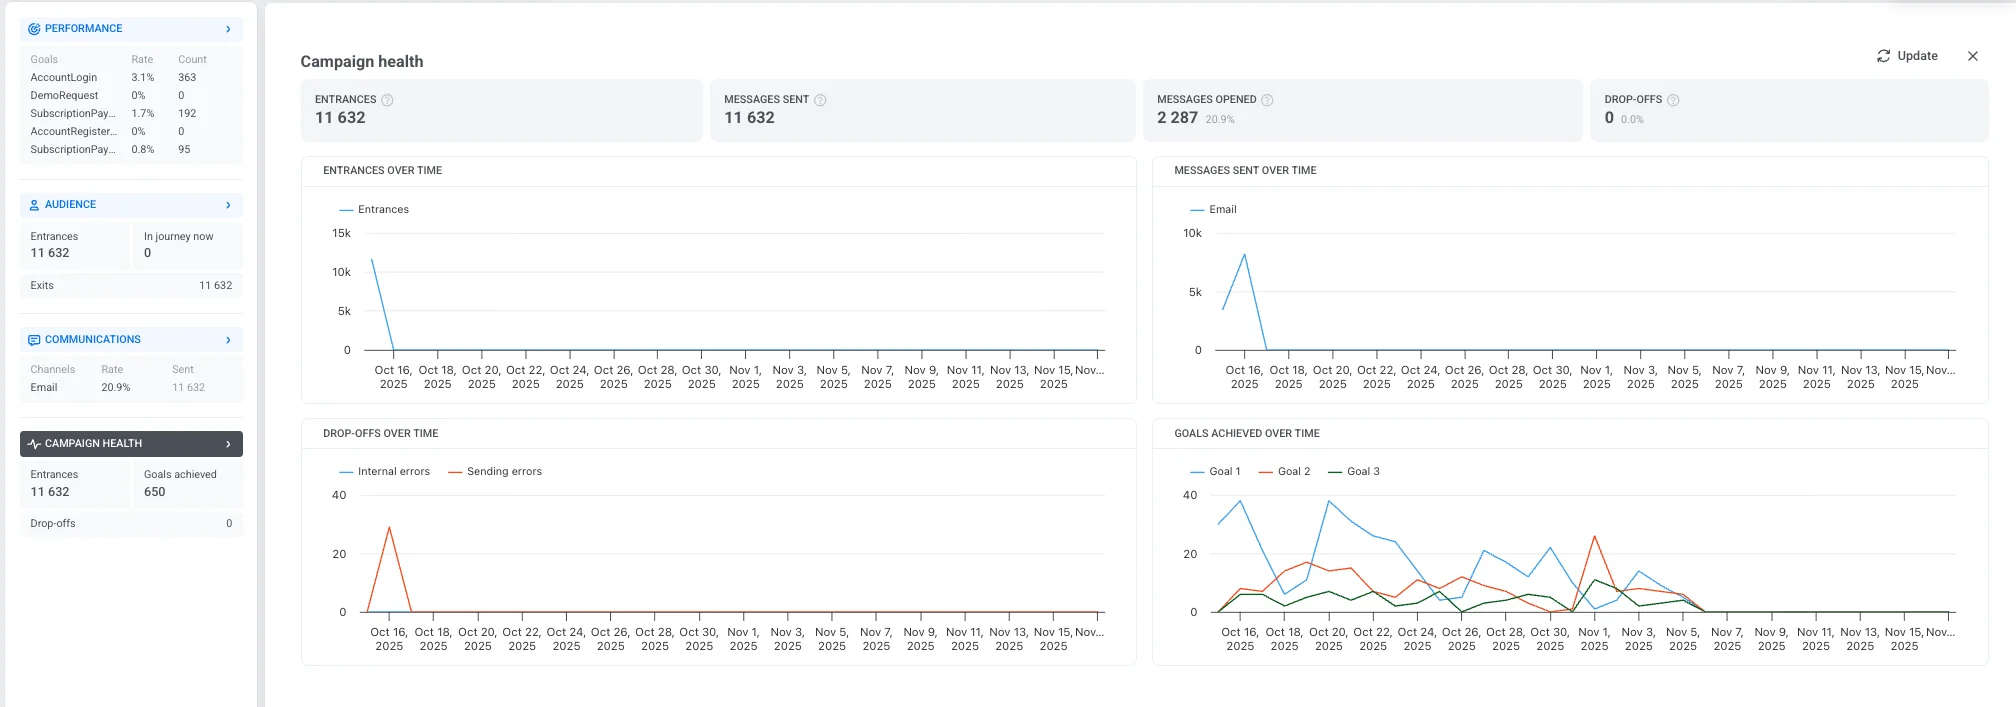
It includes the following key metrics:
| | |
| ------------------- | ------------------------------------------------------------------------------------------------------------------------------------------------- |
| **Entrances** | Total number of users who entered the campaign during the selected time period, including repeat entries. |
| **Messages sent** | Total number of messages sent within the journey. |
| **Messages opened** | The number and percentage of messages that were opened by users. |
| **Drop-offs** | The number of users removed from the campaign due to internal issues.|
The charts below help visualize key trends and behaviors throughout the campaign duration:
* **Entrances over time**
Displays the number of users entering the campaign each day.
* **Messages sent over time**
Shows daily message delivery volume across different channels.
* **Drop-offs over time**
Tracks when and why users exited the campaign, categorized by:
* **Internal errors**: Issues related to system logic or conditions.
* **Sending errors**: Failures related to message delivery.
* **Goals achieved over time**
Displays how many users completed campaign goals during the selected time range.
## Export campaign statistics
Pushwoosh allows you to export comprehensive campaign statistics for a selected date range in CSV format. This provides detailed insights into your campaign's performance, helping you analyze key metrics and optimize future campaigns.
Depending on your needs, you can export data for a single journey, multiple journeys with different statuses or categories, or even all journeys at once.
To export campaign statistics:
1. Navigate to the **Campaigns list**.
2. Locate the desired campaign or use filters to narrow down your journeys based on status, category, or other criteria. The exported CSV file will reflect these filters. Then, click **Export statistics**.
To export statistics for all your journeys, simply click **Export statistics.**
3. Select the date range for which you want to export the data and click **Export**.
4. Once the file is ready, click **Download CSV**.
Information included in the CSV export
The CSV will contain the following information:
* **Title**: Name of the campaign or journey.
* **Status**: Current status of the journey (e.g., finished, active).
* **Created**: The date and time when the journey was created.
* **Category**: The category of the campaign (e.g., Black Friday promo, Coffee promo).
* **Type**: The type of journey (e.g., AudienceBased, TriggerBased).
* **UUID**: A unique identifier for the journey.
* **Total Reach**: Total number of users targeted by the journey.
* **Unique Users**: Number of unique users who received messages in the journey.
* **Users Inside**: Number of users still active within the journey.
* **Drop-off**: Number of users who exited or dropped off from the journey.
* **Total Sends**: Total number of messages sent across all channels (push, email, SMS, etc.).
* **Avg CTR**: Average click-through rate across all message types.
* **Goals**: Number of users who reached the defined goals in the campaign.
* **Push Sends**: Number of push notifications sent in the journey.
* **Push CTR**: Click-through rate for push notifications.
* **Email Sends**: Number of email messages sent in the journey.
* **Email CTR**: Click-through rate for email messages.
* **Email Clicks**: Total number of clicks on email links.
* **Email Unsubscribes**: Number of users who unsubscribed from your email list.
* **SMS Sends**: Number of SMS messages sent in the journey.
* **SMS Deliveries**: Number of SMS messages successfully delivered.
* **WhatsApp Sends**: Number of WhatsApp messages sent in the journey.
* **WhatsApp Opens**: Number of WhatsApp messages opened by users.
* **In-App Shows**: Number of in-app messages displayed to users.
* **In-App Interaction**: Number of users who interacted with in-app messages (e.g., clicked a button).
* **In-App Skips**: Number of users who skipped or dismissed the in-app message without interacting.
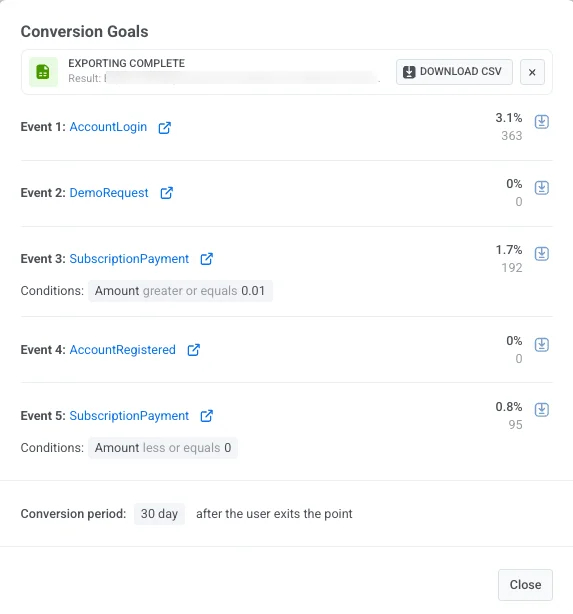 In this window, you can:
* Review conversion data for each goal.
* View goal conditions.
* See the conversion period, which shows how long conversions are tracked after a user exits the goal point (for example, *30 days after exit*).
* To save goal statistics, click **Download CSV** beside any goal to export its data as a CSV file.
## Audience
The **Audience** dashboard provides detailed information on how users interact with your campaign. It tracks user activity across the journey, including entries, exits, errors, and individual user statuses.

The dashboard includes the following key metrics:
| | |
| ------------------- | ---------------------------------------------------------------------------------------------------------------------------------------------------- |
| **Entrances** | Total number of users who entered the campaign during the selected time period, including repeat entries. |
| **In journey now** | Number of users currently active in the journey. |
| **Exits** | Number of users who have completed or exited the journey. |
| **Internal errors** | User drop-offs from the journey caused by technical issues. |
| **Sending errors** | Delivery failures caused by technical problems such as an uninstalled app, invalid email/phone, or a blocked gateway. |
The user list below displays individual journey records, helping you monitor specific cases and troubleshoot issues:
| | |
| ------------------ | ------------------------------------------------------------------------------------------------- |
| **User ID / HWID** | A unique identifier for each user. Use the search bar to find a specific user by HWID or User ID. |
| **Status** | Indicates the user's current state in the journey (e.g., *In Progress*, *Exited*, *Dropped off*). |
| **Last step** | Shows the last completed step or the point where the user exited the journey. If a user exited due to a [cancel event](/product/customer-journey/journey-settings/#remove-users-from-a-journey-without-counting-a-conversion), the column displays "Exit by Cancel event: [event name]" (e.g., "Exit by Cancel event: Cart Cleaned"). |
Click **Export CSV** to download the full list of user records and their statuses for further analysis.
## Communications
The **Communications** section provides detailed insights into how each messaging channel performs in your campaign. It helps you evaluate message delivery, engagement, and potential delivery issues so that you can optimize your communication strategy.
To open this view, click the **Communications** section name in the left panel. This opens the **Communications statistics** window where you can see how your messages are performing.

If your campaign includes multiple channels, separate tabs will be shown at the top of the window. Select a tab to switch between channels and review the metrics for each one.

### Metrics by channel
The metrics displayed in the Communications statistics window depend on the channel. Each channel tracks the statistics that are most relevant for that message type.
In this window, you can:
* Review conversion data for each goal.
* View goal conditions.
* See the conversion period, which shows how long conversions are tracked after a user exits the goal point (for example, *30 days after exit*).
* To save goal statistics, click **Download CSV** beside any goal to export its data as a CSV file.
## Audience
The **Audience** dashboard provides detailed information on how users interact with your campaign. It tracks user activity across the journey, including entries, exits, errors, and individual user statuses.

The dashboard includes the following key metrics:
| | |
| ------------------- | ---------------------------------------------------------------------------------------------------------------------------------------------------- |
| **Entrances** | Total number of users who entered the campaign during the selected time period, including repeat entries. |
| **In journey now** | Number of users currently active in the journey. |
| **Exits** | Number of users who have completed or exited the journey. |
| **Internal errors** | User drop-offs from the journey caused by technical issues. |
| **Sending errors** | Delivery failures caused by technical problems such as an uninstalled app, invalid email/phone, or a blocked gateway. |
The user list below displays individual journey records, helping you monitor specific cases and troubleshoot issues:
| | |
| ------------------ | ------------------------------------------------------------------------------------------------- |
| **User ID / HWID** | A unique identifier for each user. Use the search bar to find a specific user by HWID or User ID. |
| **Status** | Indicates the user's current state in the journey (e.g., *In Progress*, *Exited*, *Dropped off*). |
| **Last step** | Shows the last completed step or the point where the user exited the journey. If a user exited due to a [cancel event](/product/customer-journey/journey-settings/#remove-users-from-a-journey-without-counting-a-conversion), the column displays "Exit by Cancel event: [event name]" (e.g., "Exit by Cancel event: Cart Cleaned"). |
Click **Export CSV** to download the full list of user records and their statuses for further analysis.
## Communications
The **Communications** section provides detailed insights into how each messaging channel performs in your campaign. It helps you evaluate message delivery, engagement, and potential delivery issues so that you can optimize your communication strategy.
To open this view, click the **Communications** section name in the left panel. This opens the **Communications statistics** window where you can see how your messages are performing.

If your campaign includes multiple channels, separate tabs will be shown at the top of the window. Select a tab to switch between channels and review the metrics for each one.

### Metrics by channel
The metrics displayed in the Communications statistics window depend on the channel. Each channel tracks the statistics that are most relevant for that message type.
 3. Select the date range for which you want to export the data and click **Export**.
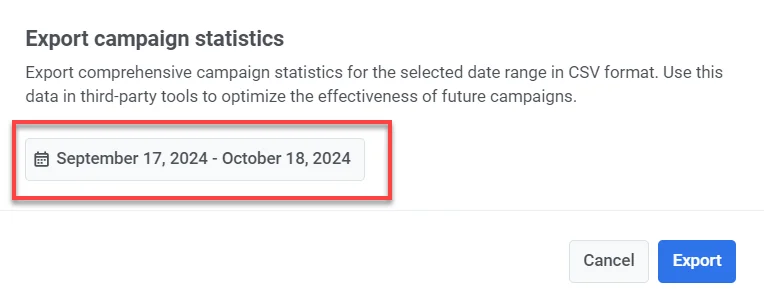 4. Once the file is ready, click **Download CSV**.