# Journey element statistics
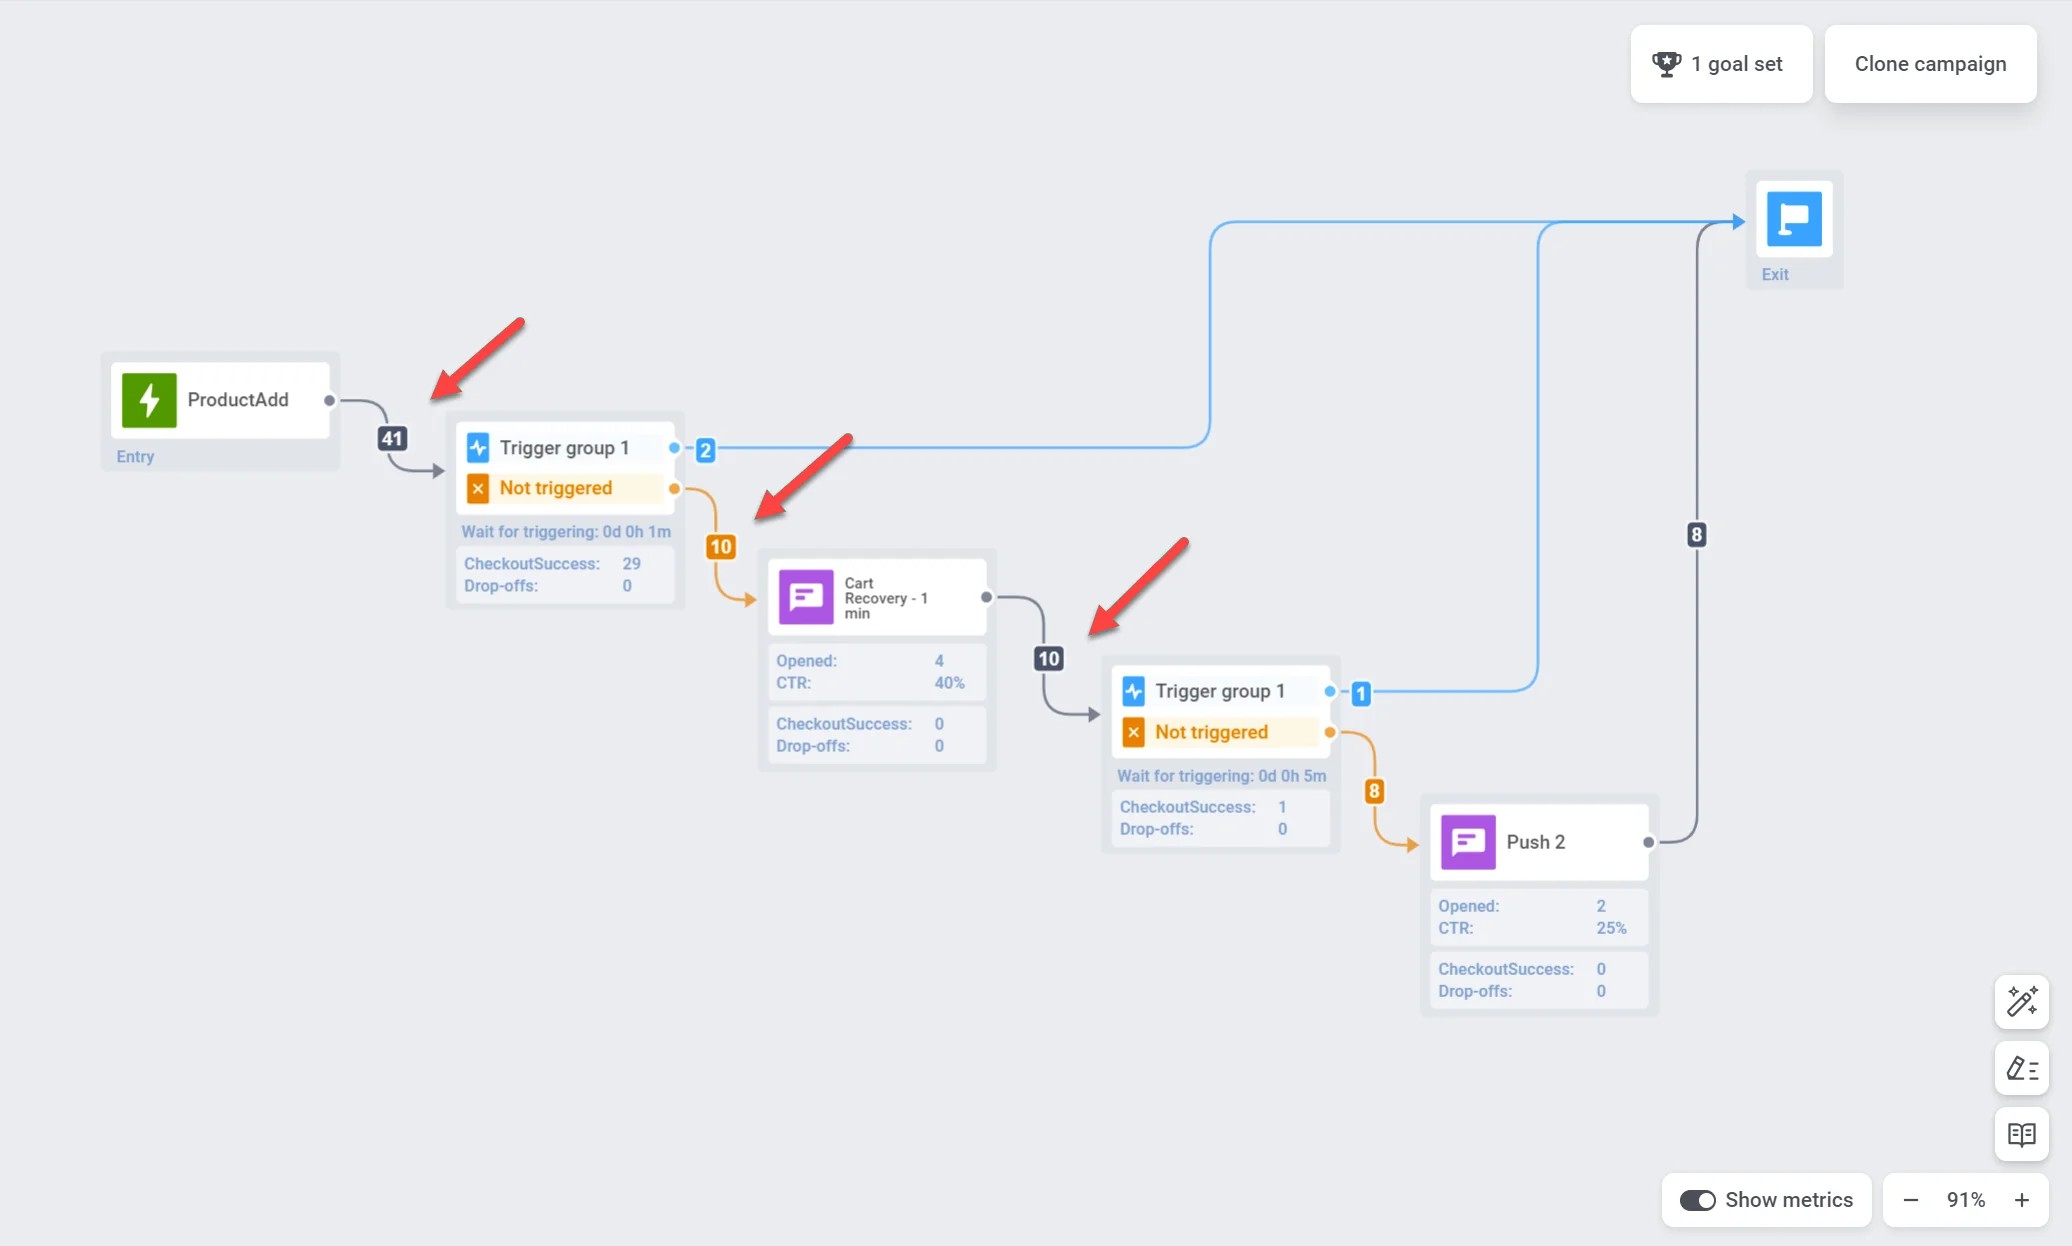
To display metrics for each journey element on the canvas, toggle on **Show Metrics** at the bottom of the canvas. Alternatively, you can hover over the element to view the metrics.
## Audience progress
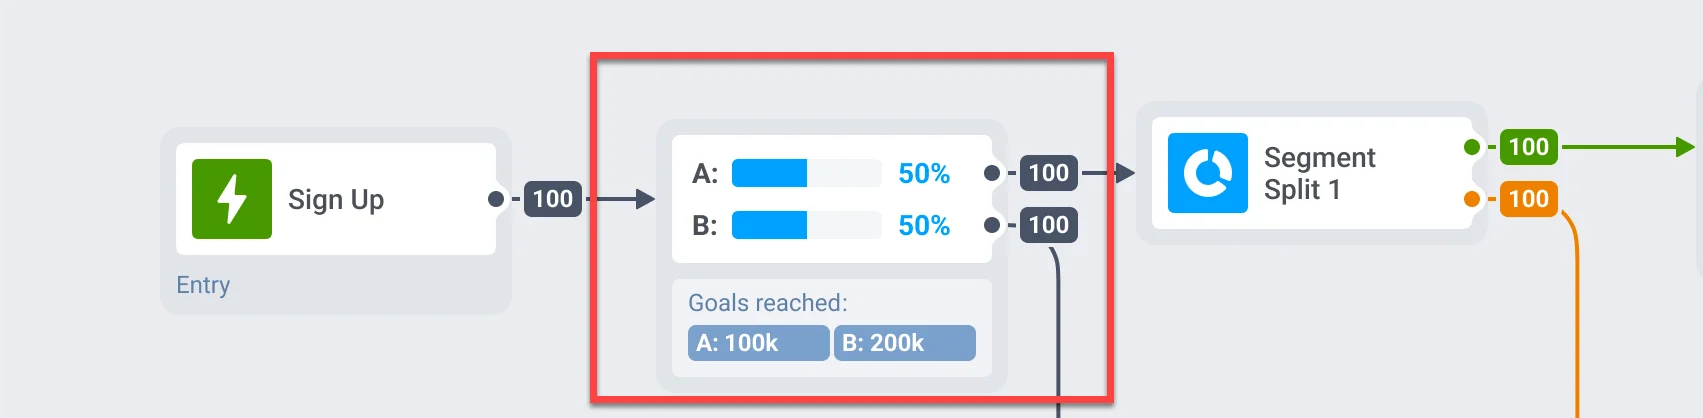
Pushwoosh allows you to keep track of your audience as they progress through the journey with real-time visualization on the canvas. A number on the arrow following each journey element indicates the total number of customers who have completed that particular step.
## Statistics for each communication point
You can gain insights into the performance of each communication point through metrics such as:
### Push notifications and email messages
| | |
|-----------------|-----------------------------------------------------------------------------------------------------|
| Goals reached | Indicates the number of users who reached the Conversion Goal at that specific point. |
| Opened | Displays the number of times the message was opened by users. |
| CTR | Represents the percentage of users who clicked on the message. |
| Drop-offs | Represents the number of messages that couldn't be sent for some reason (e.g., an expired push token or an invalid email address). |
| Exited by Conversion goals or Cancel events | Number of users who exited the journey at this point due to reaching a conversion goal or triggering a [cancel event](/product/customer-journey/journey-settings/#remove-users-from-a-journey-without-counting-a-conversion). |
For deeper insights into individual message effectiveness, double-click on a message element on the canvas. A detailed statistics window will pop up, displaying key metrics for the message such as:
* number of sent messages
* number of opened messages
* conversion rate
* number of entries
* number of drop-offs,
* number of clicks, etc.
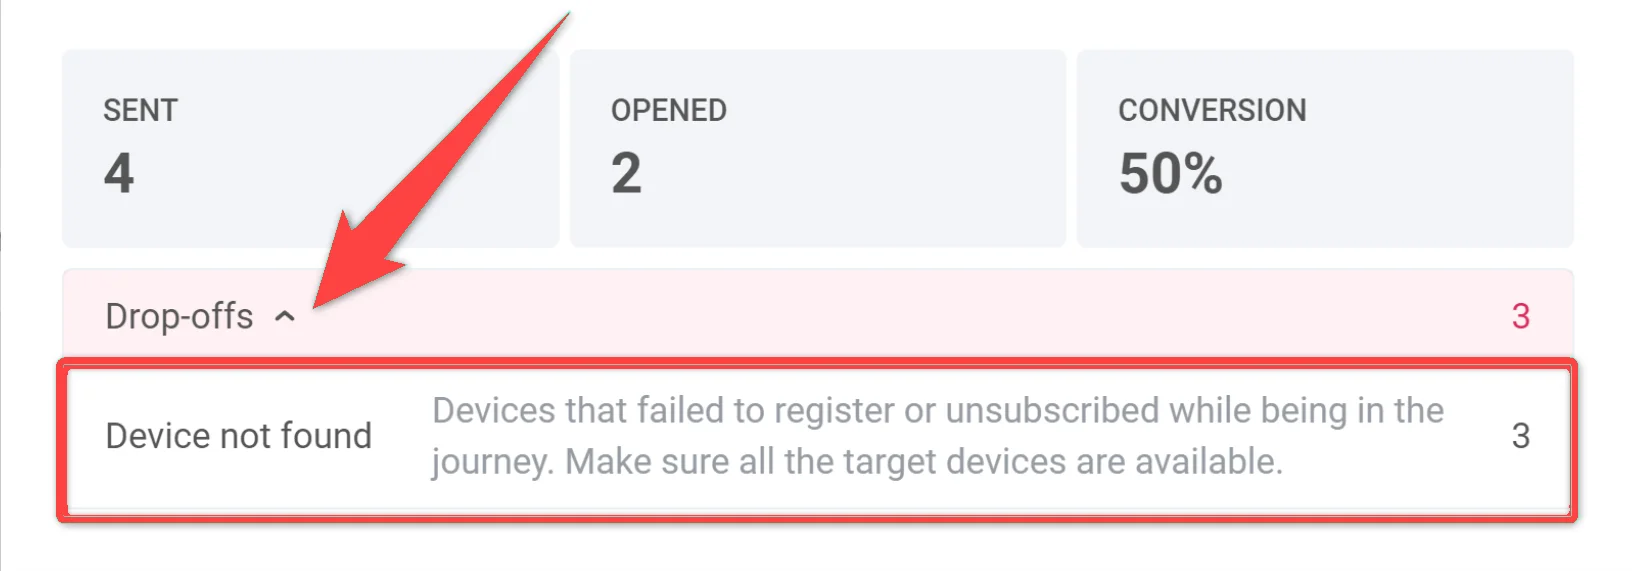
To see the reasons for drop-offs and the number of drop-offs for each cause, expand the **Drop-off** block.
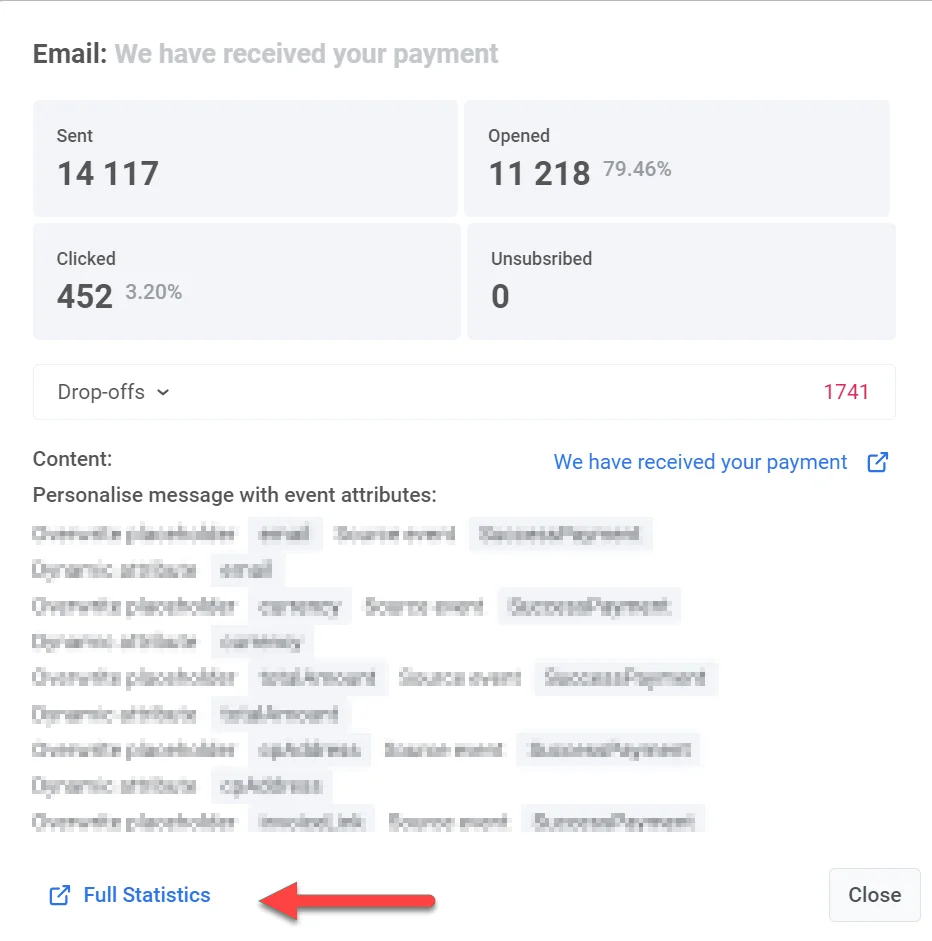
To access even more comprehensive statistics for a message, click **Detailed Statistics** at the bottom of the window.
### In-apps
| | |
|------------------|-----------------------------------------------------------------------------------------------------|
| Goals reached | Indicates the number of users who reached the Conversion Goal at that specific point. |
| Drop-offs | Represents the number of in-app messages that could not be displayed to users. |
For a more detailed understanding of your in-app message's performance, double-click on the message element and then, in the window that appears, click on the Rich media name. This will open up comprehensive message statistics.
### SMS
| | |
|------------------|-----------------------------------------------------------------------------------------------------|
| Goals reached | Indicates the number of users who reached the Conversion Goal at that specific point. |
| Sent | Indicates the number of messages sent. |
### Telegram
| | |
|------------------|-----------------------------------------------------------------------------------------------------|
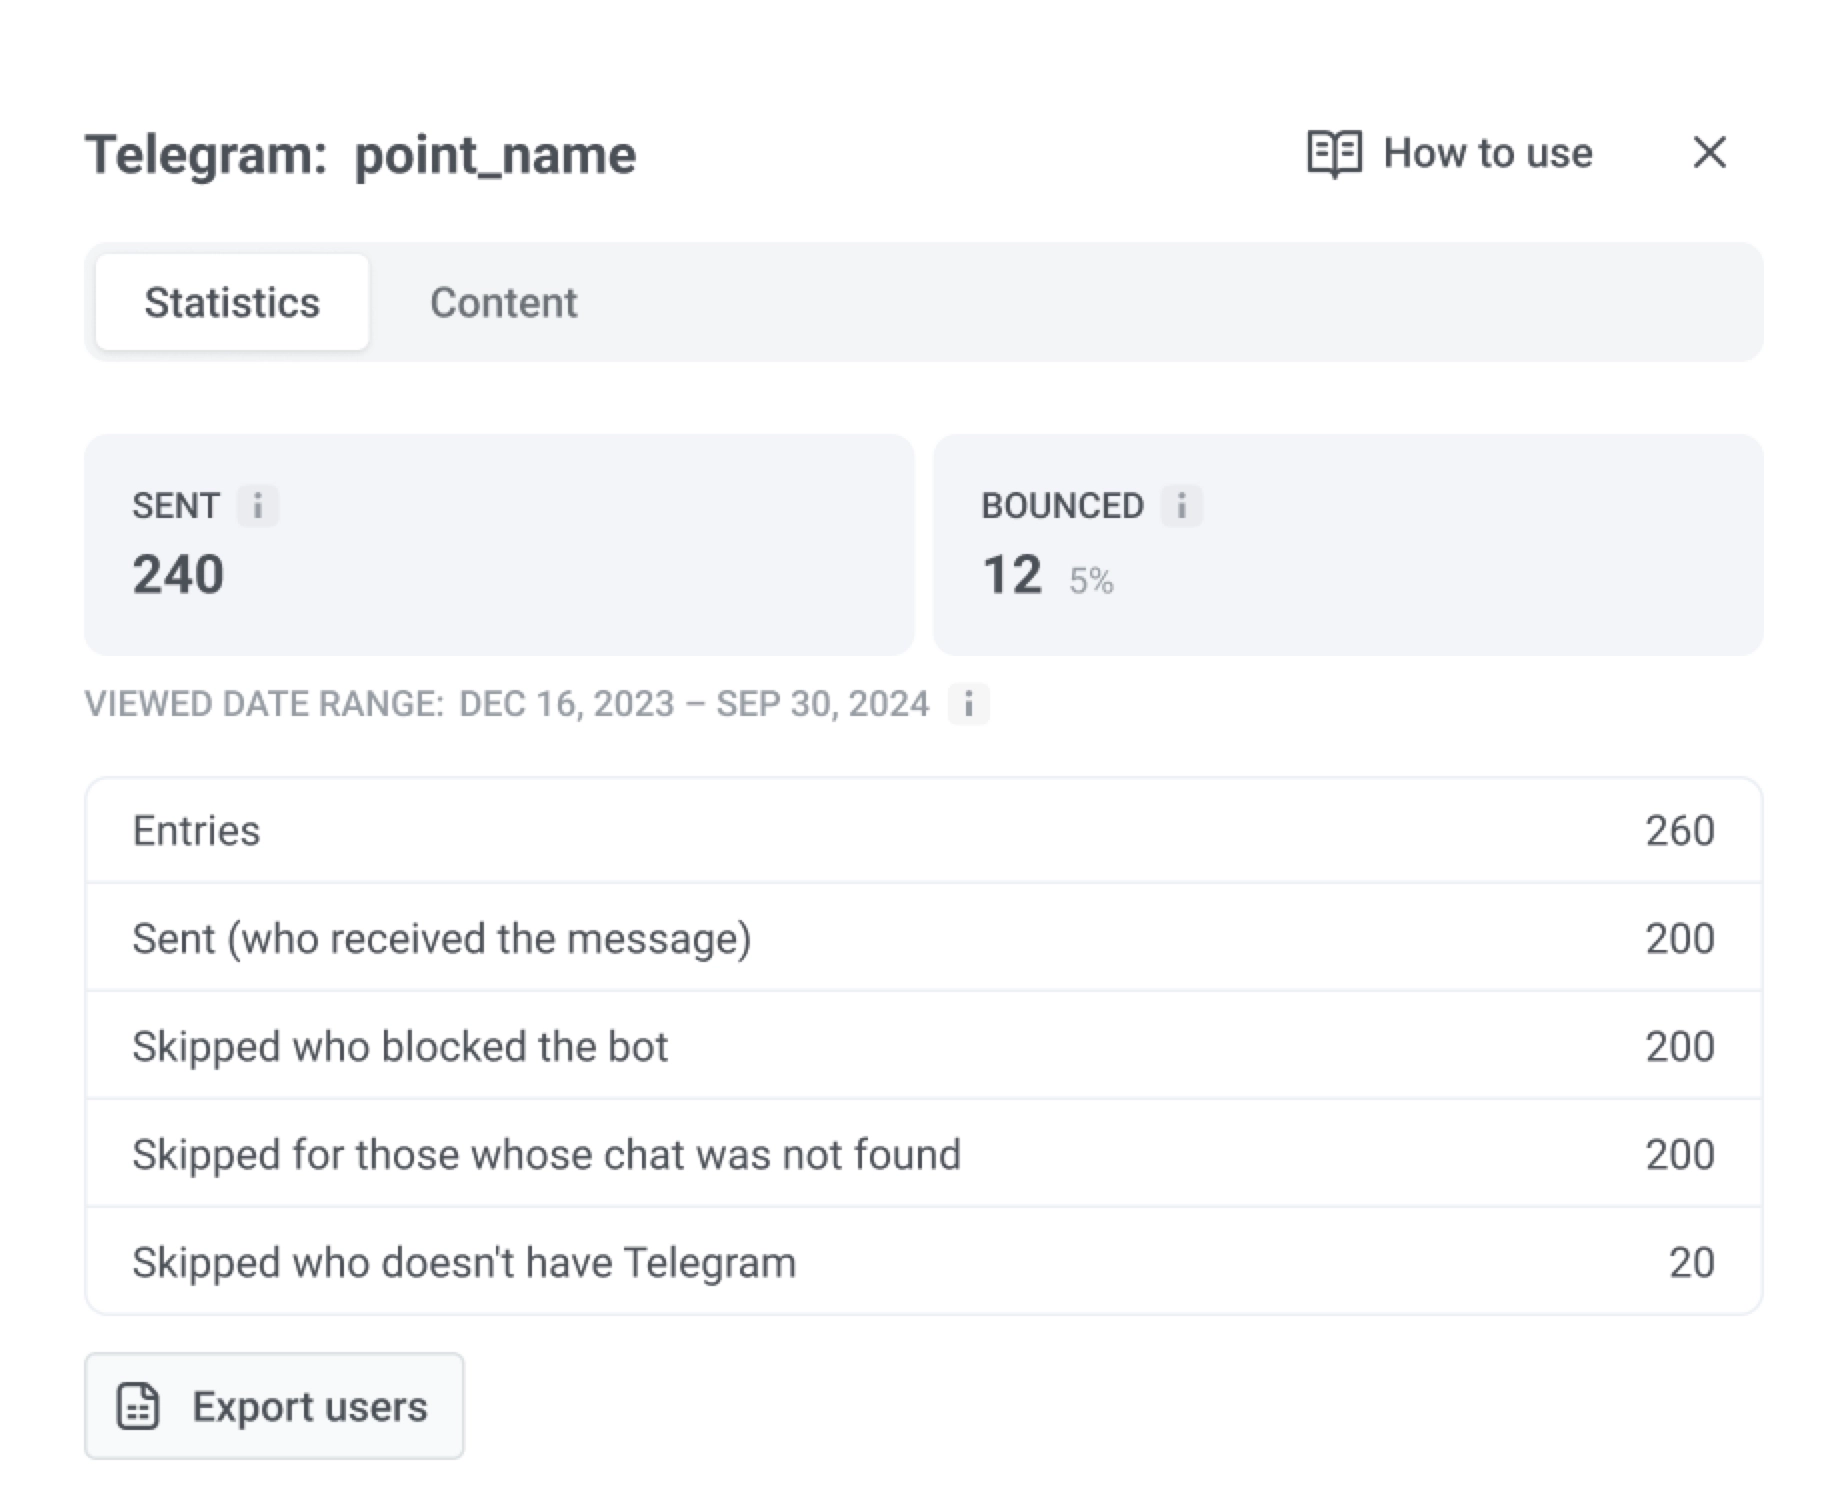
| Sent | Indicates the number of Telegram messages sent. |
| Bounced | Indicates the number of Telegram messages that could not be delivered. |
| Entries | Indicates the number of users who reached the Telegram element. |
| Sent (who received the message) | Indicates the number of users who successfully received the Telegram message. |
You can also review **Viewed date range: all time** and click **Export users**.
### Audience sync
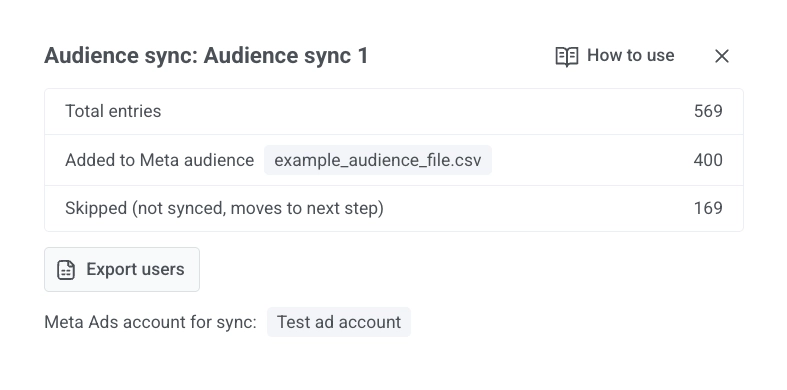
For an **Audience sync** element, the statistics view includes:
| | |
|------------------|-----------------------------------------------------------------------------------------------------|
| Total entries | Indicates how many users reached this step in the journey. |
| Added to Meta audience | Indicates how many users Meta matched and added to the audience you selected. |
| Removed from Meta audience | Indicates how many users Meta matched and removed from the audience you selected. |
| Skipped (not synced, moves to next step) | Indicates how many users were not synced. They continue to the next step in the journey. |
You can **Export users** from this view. The screen also shows which **Meta Ads account** was used for the sync.
### A/B/n test statistics
If you conduct A/B/n tests on different elements of your customer journey, you can quickly identify the best-performing variant of each element.
### Still waiting
The **Still waiting** metric in Pushwoosh Customer Journey applies to **Time Delay** and **Wait for Trigger** steps. It helps monitor user flow, identify delays, and optimize your customer journey setup.
#### Wait for trigger
Shows the number of users currently waiting to trigger a specific event. These users have entered the step but have not yet fulfilled the required conditions within the defined waiting period.
#### Time delay
Reflects users still in the waiting period before proceeding to the next step.
## Export statistics for each step of your customer journey
You can export users who passed through each step of your customer journey, including elements like push notifications, emails, in-app messages, Wait for Trigger, Condition split, etc. This allows you to analyze the performance of individual campaign elements.
To export statistics:
1. Open the campaign you want to track in the **Customer Journey Builder**.
2. Click on the specific journey step for which you want to export statistics.
3. Click **Export statistics**.
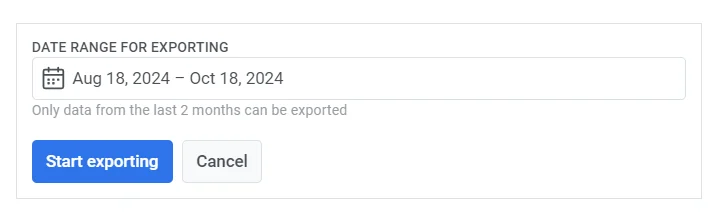
4. Specify the **date range** for the data you wish to export and click **Start exporting**.
5. Once the export process is complete, Pushwoosh will display a confirmation message. Click on the file to download the exported data, or choose to export another period if needed.
 ## Statistics for each communication point
You can gain insights into the performance of each communication point through metrics such as:
### Push notifications and email messages
| | |
|-----------------|-----------------------------------------------------------------------------------------------------|
| Goals reached | Indicates the number of users who reached the Conversion Goal at that specific point. |
| Opened | Displays the number of times the message was opened by users. |
| CTR | Represents the percentage of users who clicked on the message. |
| Drop-offs | Represents the number of messages that couldn't be sent for some reason (e.g., an expired push token or an invalid email address). |
| Exited by Conversion goals or Cancel events | Number of users who exited the journey at this point due to reaching a conversion goal or triggering a [cancel event](/product/customer-journey/journey-settings/#remove-users-from-a-journey-without-counting-a-conversion). |
For deeper insights into individual message effectiveness, double-click on a message element on the canvas. A detailed statistics window will pop up, displaying key metrics for the message such as:
* number of sent messages
* number of opened messages
* conversion rate
* number of entries
* number of drop-offs,
* number of clicks, etc.
To see the reasons for drop-offs and the number of drop-offs for each cause, expand the **Drop-off** block.
## Statistics for each communication point
You can gain insights into the performance of each communication point through metrics such as:
### Push notifications and email messages
| | |
|-----------------|-----------------------------------------------------------------------------------------------------|
| Goals reached | Indicates the number of users who reached the Conversion Goal at that specific point. |
| Opened | Displays the number of times the message was opened by users. |
| CTR | Represents the percentage of users who clicked on the message. |
| Drop-offs | Represents the number of messages that couldn't be sent for some reason (e.g., an expired push token or an invalid email address). |
| Exited by Conversion goals or Cancel events | Number of users who exited the journey at this point due to reaching a conversion goal or triggering a [cancel event](/product/customer-journey/journey-settings/#remove-users-from-a-journey-without-counting-a-conversion). |
For deeper insights into individual message effectiveness, double-click on a message element on the canvas. A detailed statistics window will pop up, displaying key metrics for the message such as:
* number of sent messages
* number of opened messages
* conversion rate
* number of entries
* number of drop-offs,
* number of clicks, etc.
To see the reasons for drop-offs and the number of drop-offs for each cause, expand the **Drop-off** block.
 To access even more comprehensive statistics for a message, click **Detailed Statistics** at the bottom of the window.
 ### In-apps
| | |
|------------------|-----------------------------------------------------------------------------------------------------|
| Goals reached | Indicates the number of users who reached the Conversion Goal at that specific point. |
| Drop-offs | Represents the number of in-app messages that could not be displayed to users. |
For a more detailed understanding of your in-app message's performance, double-click on the message element and then, in the window that appears, click on the Rich media name. This will open up comprehensive message statistics.
### SMS
| | |
|------------------|-----------------------------------------------------------------------------------------------------|
| Goals reached | Indicates the number of users who reached the Conversion Goal at that specific point. |
| Sent | Indicates the number of messages sent. |
### Telegram
| | |
|------------------|-----------------------------------------------------------------------------------------------------|
| Sent | Indicates the number of Telegram messages sent. |
| Bounced | Indicates the number of Telegram messages that could not be delivered. |
| Entries | Indicates the number of users who reached the Telegram element. |
| Sent (who received the message) | Indicates the number of users who successfully received the Telegram message. |
You can also review **Viewed date range: all time** and click **Export users**.
### In-apps
| | |
|------------------|-----------------------------------------------------------------------------------------------------|
| Goals reached | Indicates the number of users who reached the Conversion Goal at that specific point. |
| Drop-offs | Represents the number of in-app messages that could not be displayed to users. |
For a more detailed understanding of your in-app message's performance, double-click on the message element and then, in the window that appears, click on the Rich media name. This will open up comprehensive message statistics.
### SMS
| | |
|------------------|-----------------------------------------------------------------------------------------------------|
| Goals reached | Indicates the number of users who reached the Conversion Goal at that specific point. |
| Sent | Indicates the number of messages sent. |
### Telegram
| | |
|------------------|-----------------------------------------------------------------------------------------------------|
| Sent | Indicates the number of Telegram messages sent. |
| Bounced | Indicates the number of Telegram messages that could not be delivered. |
| Entries | Indicates the number of users who reached the Telegram element. |
| Sent (who received the message) | Indicates the number of users who successfully received the Telegram message. |
You can also review **Viewed date range: all time** and click **Export users**.
 ### Audience sync
For an **Audience sync** element, the statistics view includes:
| | |
|------------------|-----------------------------------------------------------------------------------------------------|
| Total entries | Indicates how many users reached this step in the journey. |
| Added to Meta audience | Indicates how many users Meta matched and added to the audience you selected. |
| Removed from Meta audience | Indicates how many users Meta matched and removed from the audience you selected. |
| Skipped (not synced, moves to next step) | Indicates how many users were not synced. They continue to the next step in the journey. |
You can **Export users** from this view. The screen also shows which **Meta Ads account** was used for the sync.
### Audience sync
For an **Audience sync** element, the statistics view includes:
| | |
|------------------|-----------------------------------------------------------------------------------------------------|
| Total entries | Indicates how many users reached this step in the journey. |
| Added to Meta audience | Indicates how many users Meta matched and added to the audience you selected. |
| Removed from Meta audience | Indicates how many users Meta matched and removed from the audience you selected. |
| Skipped (not synced, moves to next step) | Indicates how many users were not synced. They continue to the next step in the journey. |
You can **Export users** from this view. The screen also shows which **Meta Ads account** was used for the sync.
 ### A/B/n test statistics
If you conduct A/B/n tests on different elements of your customer journey, you can quickly identify the best-performing variant of each element.
### A/B/n test statistics
If you conduct A/B/n tests on different elements of your customer journey, you can quickly identify the best-performing variant of each element.
 ### Still waiting
The **Still waiting** metric in Pushwoosh Customer Journey applies to **Time Delay** and **Wait for Trigger** steps. It helps monitor user flow, identify delays, and optimize your customer journey setup.
#### Wait for trigger
Shows the number of users currently waiting to trigger a specific event. These users have entered the step but have not yet fulfilled the required conditions within the defined waiting period.
#### Time delay
Reflects users still in the waiting period before proceeding to the next step.
## Export statistics for each step of your customer journey
You can export users who passed through each step of your customer journey, including elements like push notifications, emails, in-app messages, Wait for Trigger, Condition split, etc. This allows you to analyze the performance of individual campaign elements.
To export statistics:
1. Open the campaign you want to track in the **Customer Journey Builder**.
2. Click on the specific journey step for which you want to export statistics.
3. Click **Export statistics**.
4. Specify the **date range** for the data you wish to export and click **Start exporting**.
### Still waiting
The **Still waiting** metric in Pushwoosh Customer Journey applies to **Time Delay** and **Wait for Trigger** steps. It helps monitor user flow, identify delays, and optimize your customer journey setup.
#### Wait for trigger
Shows the number of users currently waiting to trigger a specific event. These users have entered the step but have not yet fulfilled the required conditions within the defined waiting period.
#### Time delay
Reflects users still in the waiting period before proceeding to the next step.
## Export statistics for each step of your customer journey
You can export users who passed through each step of your customer journey, including elements like push notifications, emails, in-app messages, Wait for Trigger, Condition split, etc. This allows you to analyze the performance of individual campaign elements.
To export statistics:
1. Open the campaign you want to track in the **Customer Journey Builder**.
2. Click on the specific journey step for which you want to export statistics.
3. Click **Export statistics**.
4. Specify the **date range** for the data you wish to export and click **Start exporting**.
 5. Once the export process is complete, Pushwoosh will display a confirmation message. Click on the file to download the exported data, or choose to export another period if needed.
