# Creating and customizing dashboards
## Dashboards list
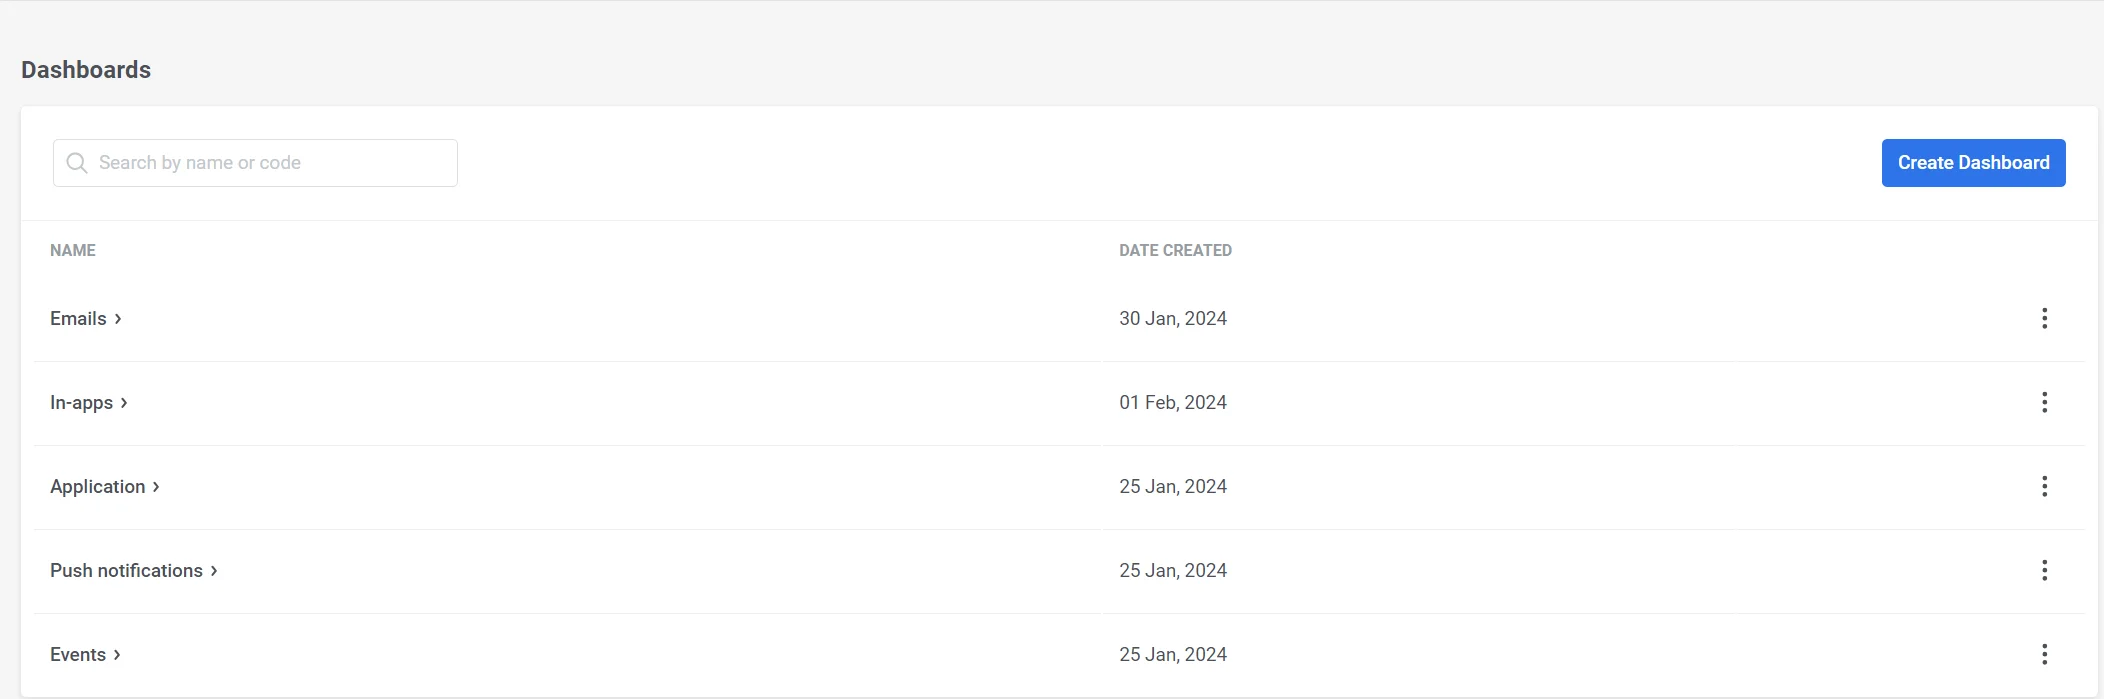
To gain insights into the performance of your application and campaigns, navigate to **Statistics → Dashboards.** Here, you'll discover a list of existing dashboards and can create new custom ones.
The list provides the names of the dashboards along with their creation dates, making it easy to manage and access your data.
To manage a dashboard, simply click the three dots next to its name, and you'll have access to the following actions:
* **Open Dashboard**
* **Rename:** Use this option to modify the dashboard's name if necessary, helping you keep your dashboards organized and up-to-date.
* **Delete:** If you no longer require a dashboard, you can use this option to remove it. Please note that this action cannot be undone.
## Preconfigured dashboards
By default, Pushwoosh offers a range of pre-built dashboards tailored to various aspects of your campaigns. These dashboards include:
* Application Dashboard
* Push Notifications Dashboard
* Emails Dashboard
* In-apps Dashboard
* Events Dashboard
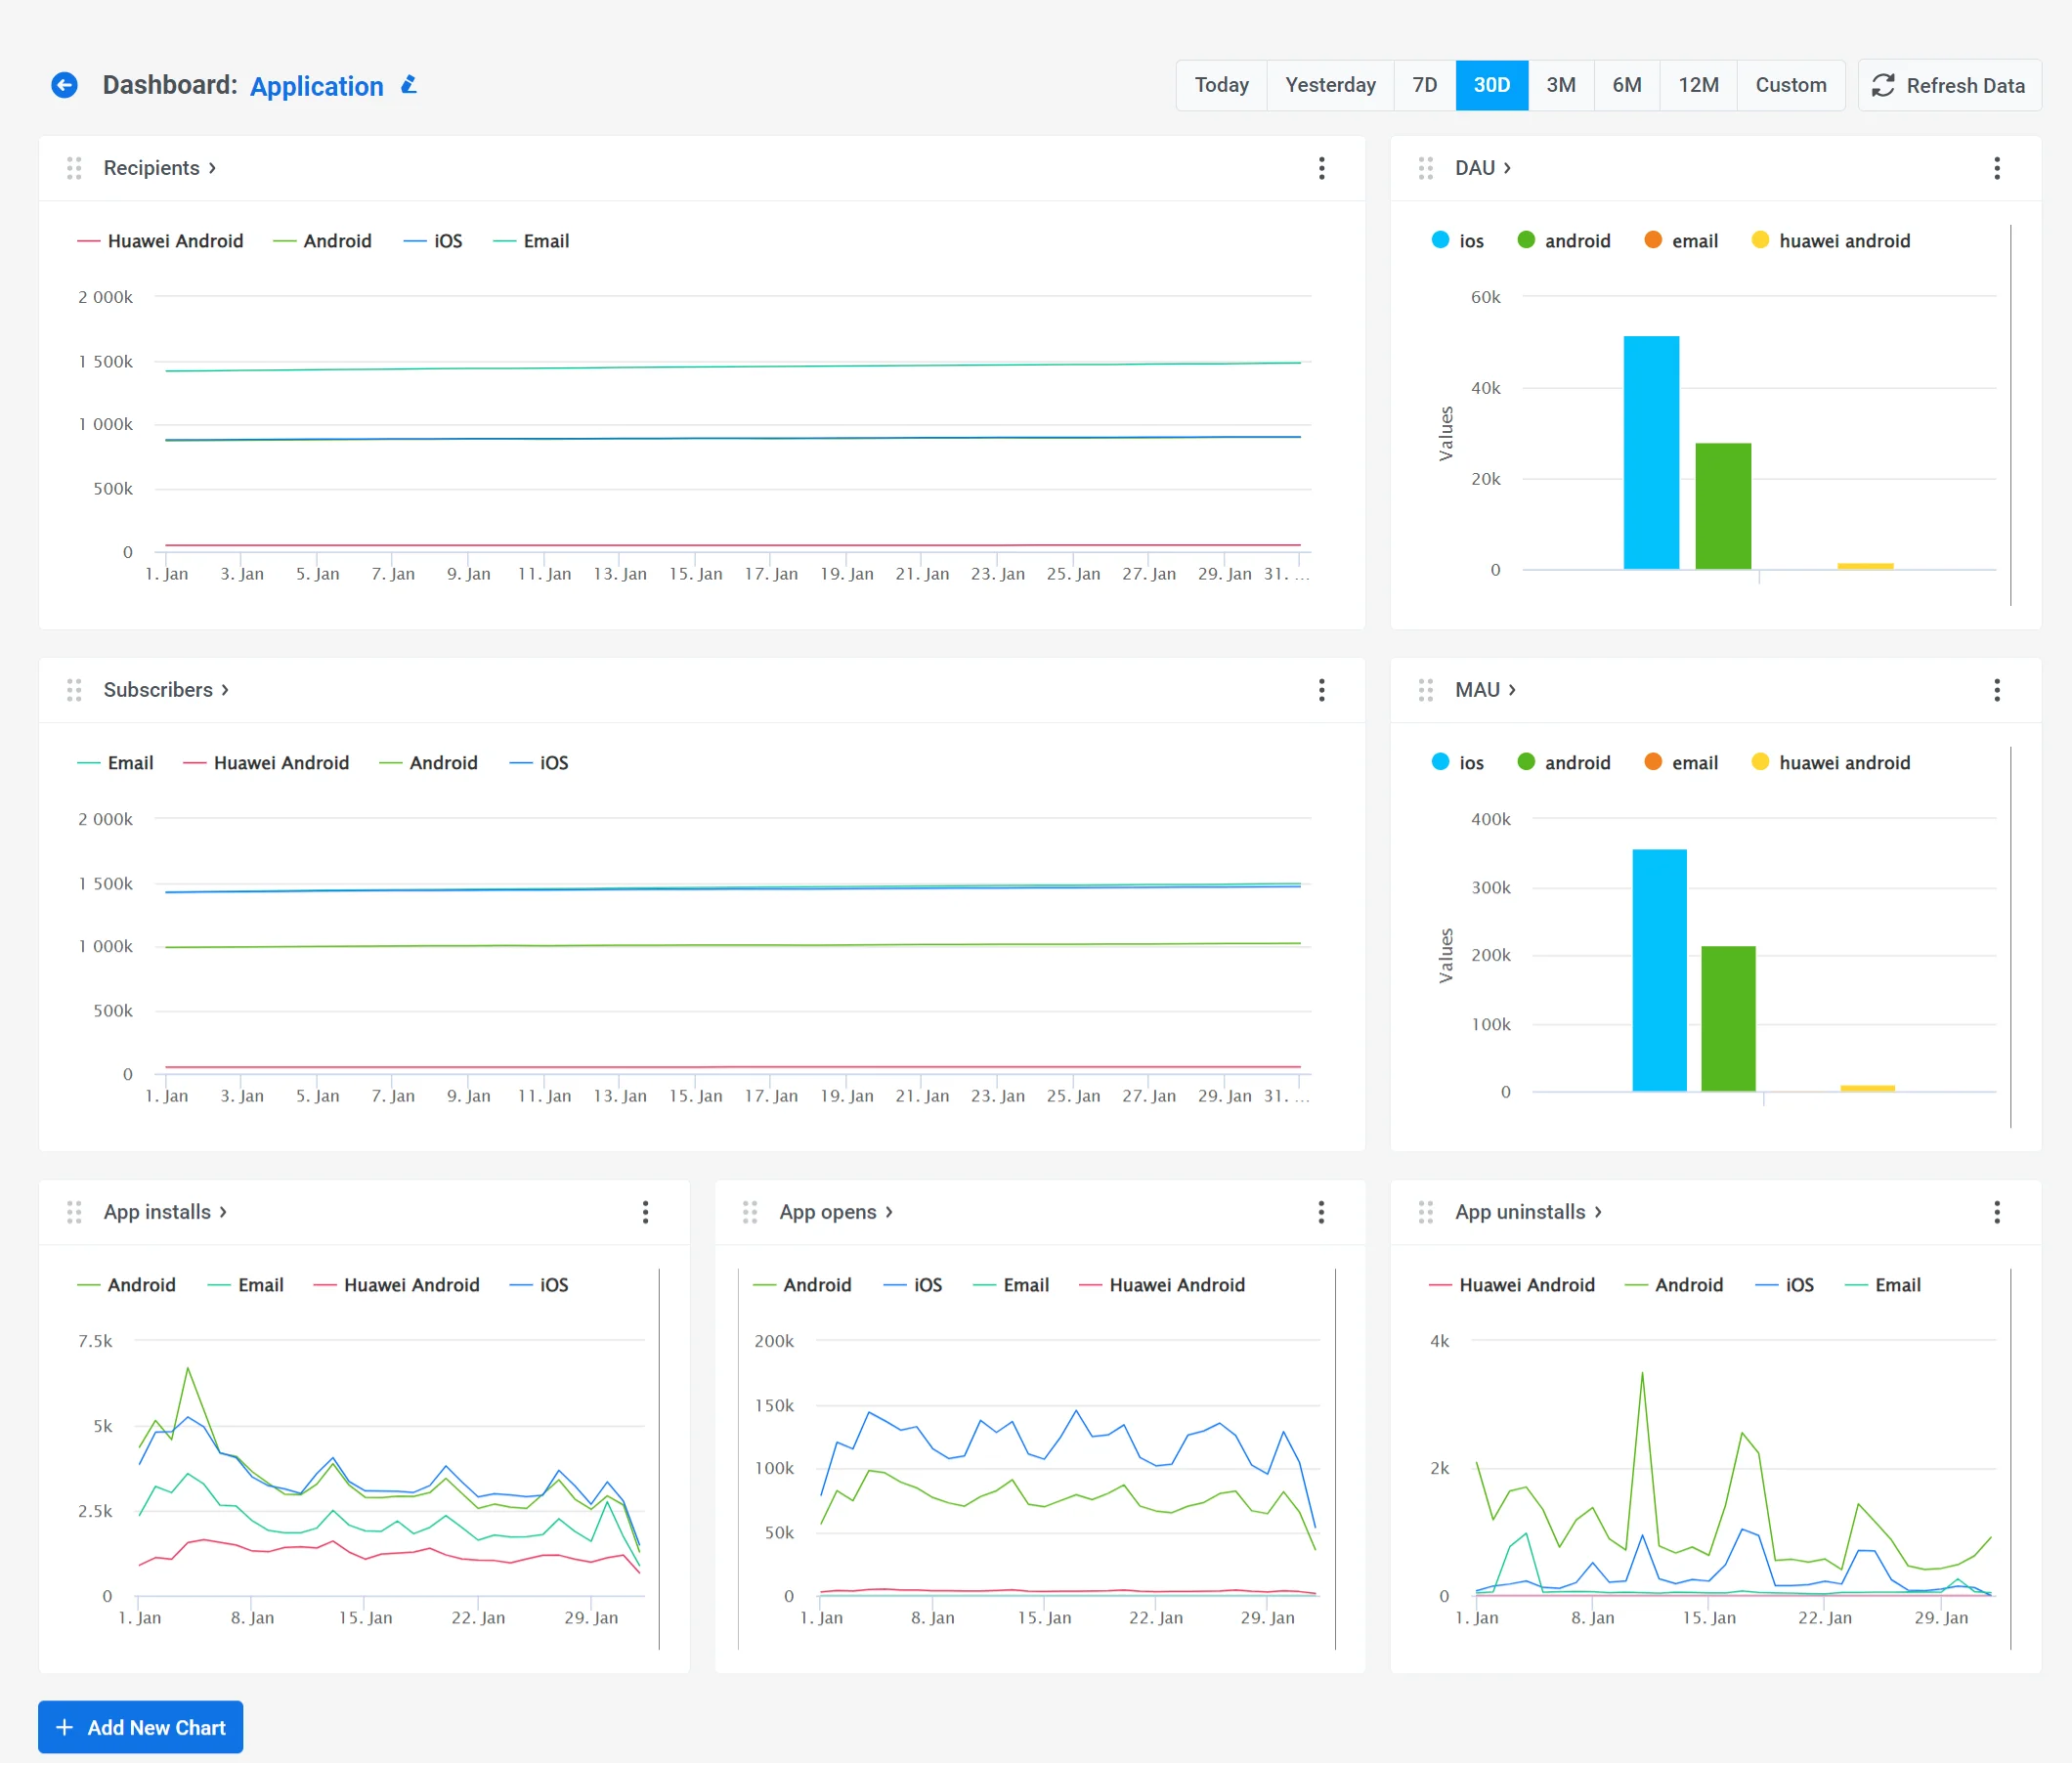
The **Application** dashboard is designed to help you monitor your app's performance.
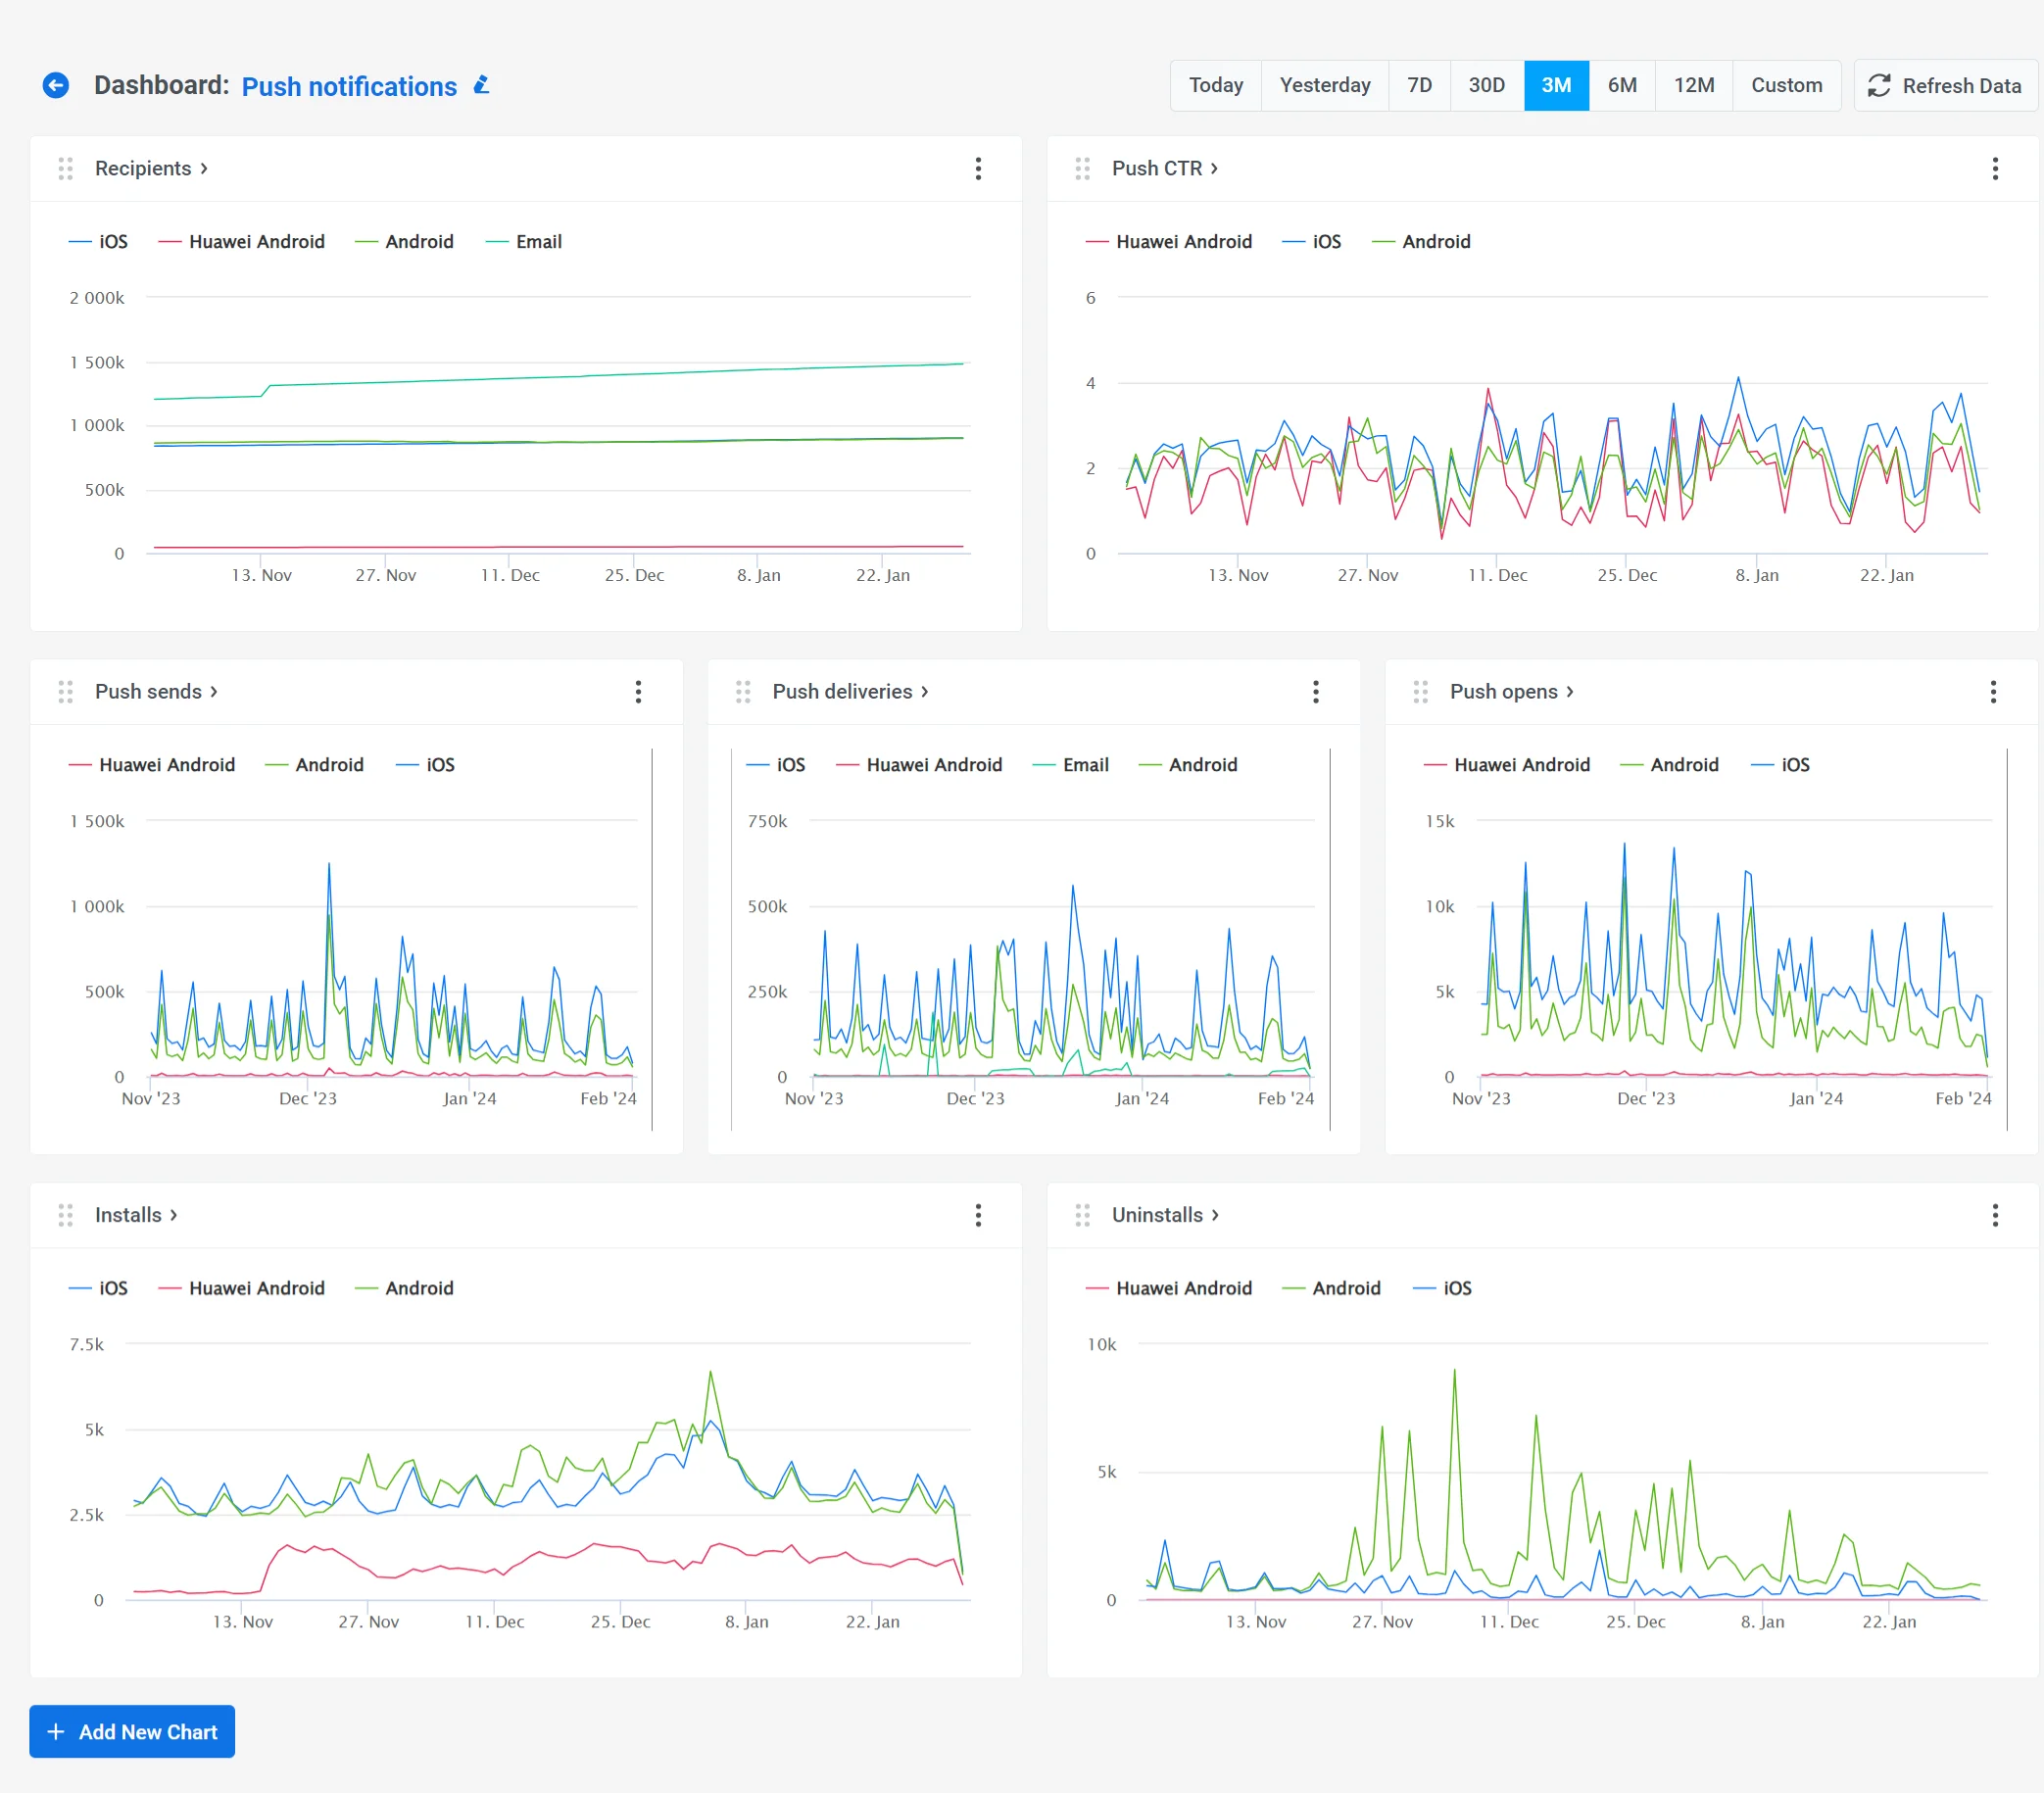
The **Push Notifications** dashboard is designed to help you track how your push notifications campaigns perform.
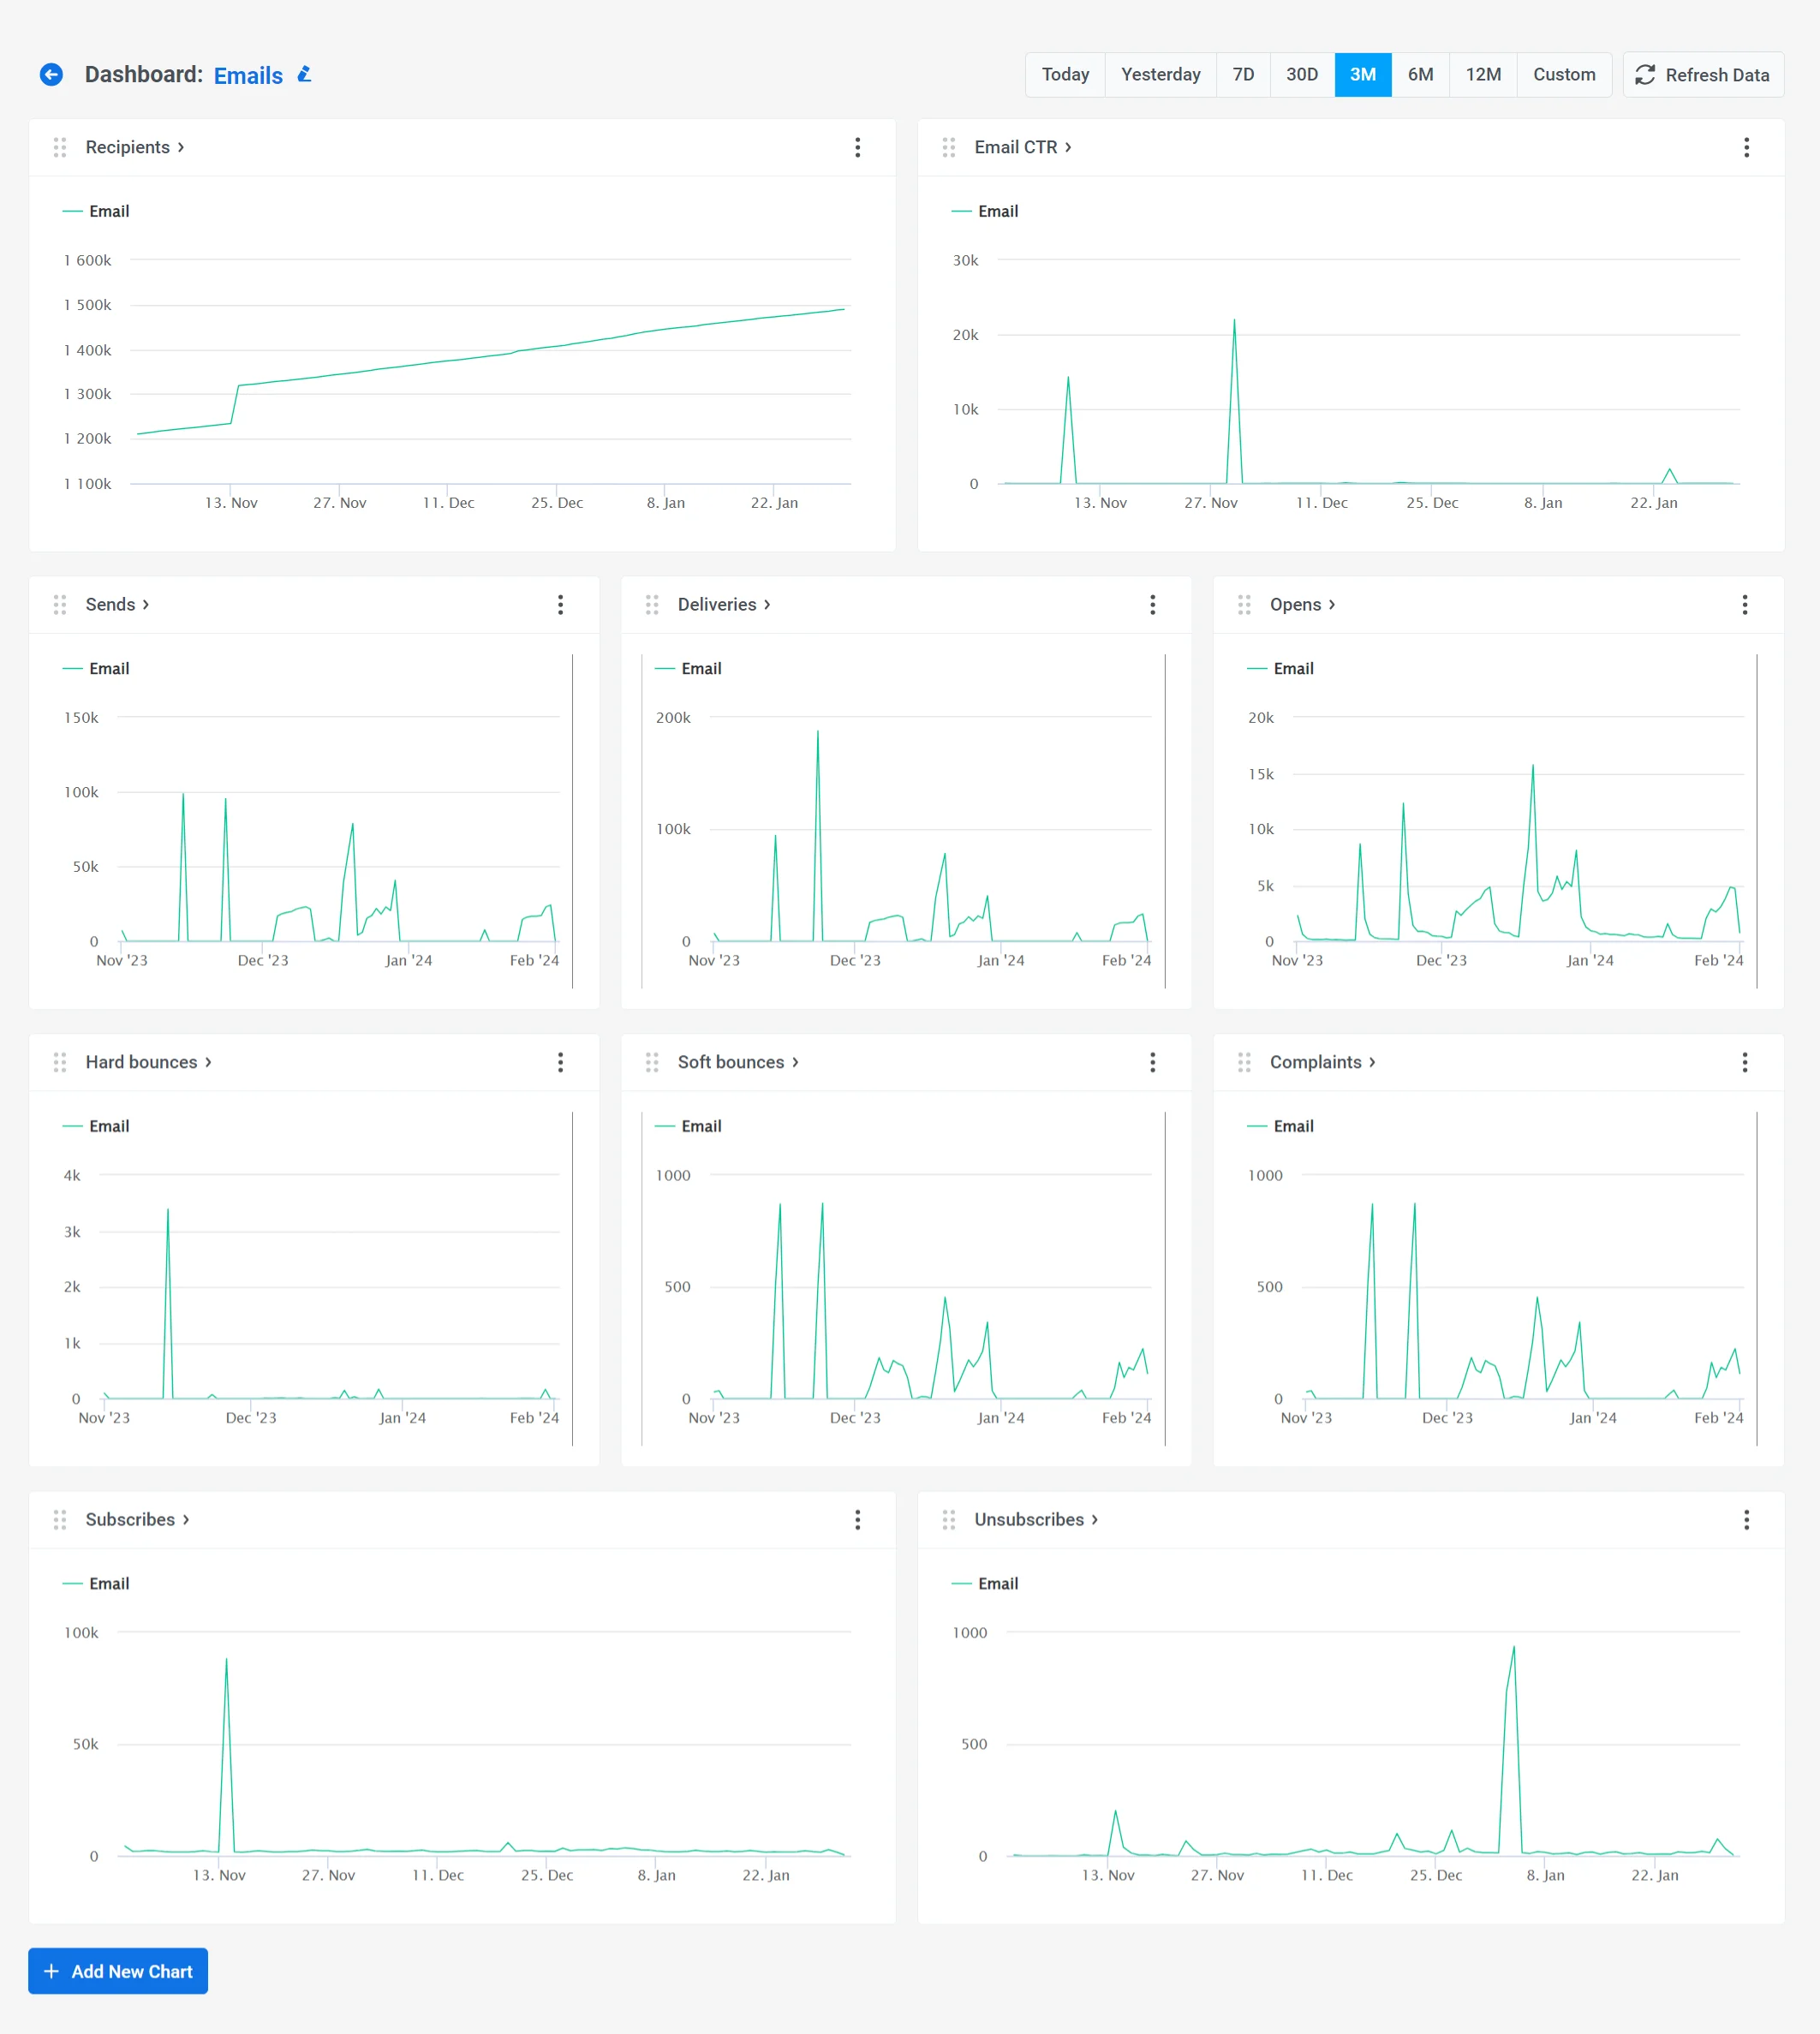
The **Emails** dashboard allows you to gauge email campaign effectiveness.
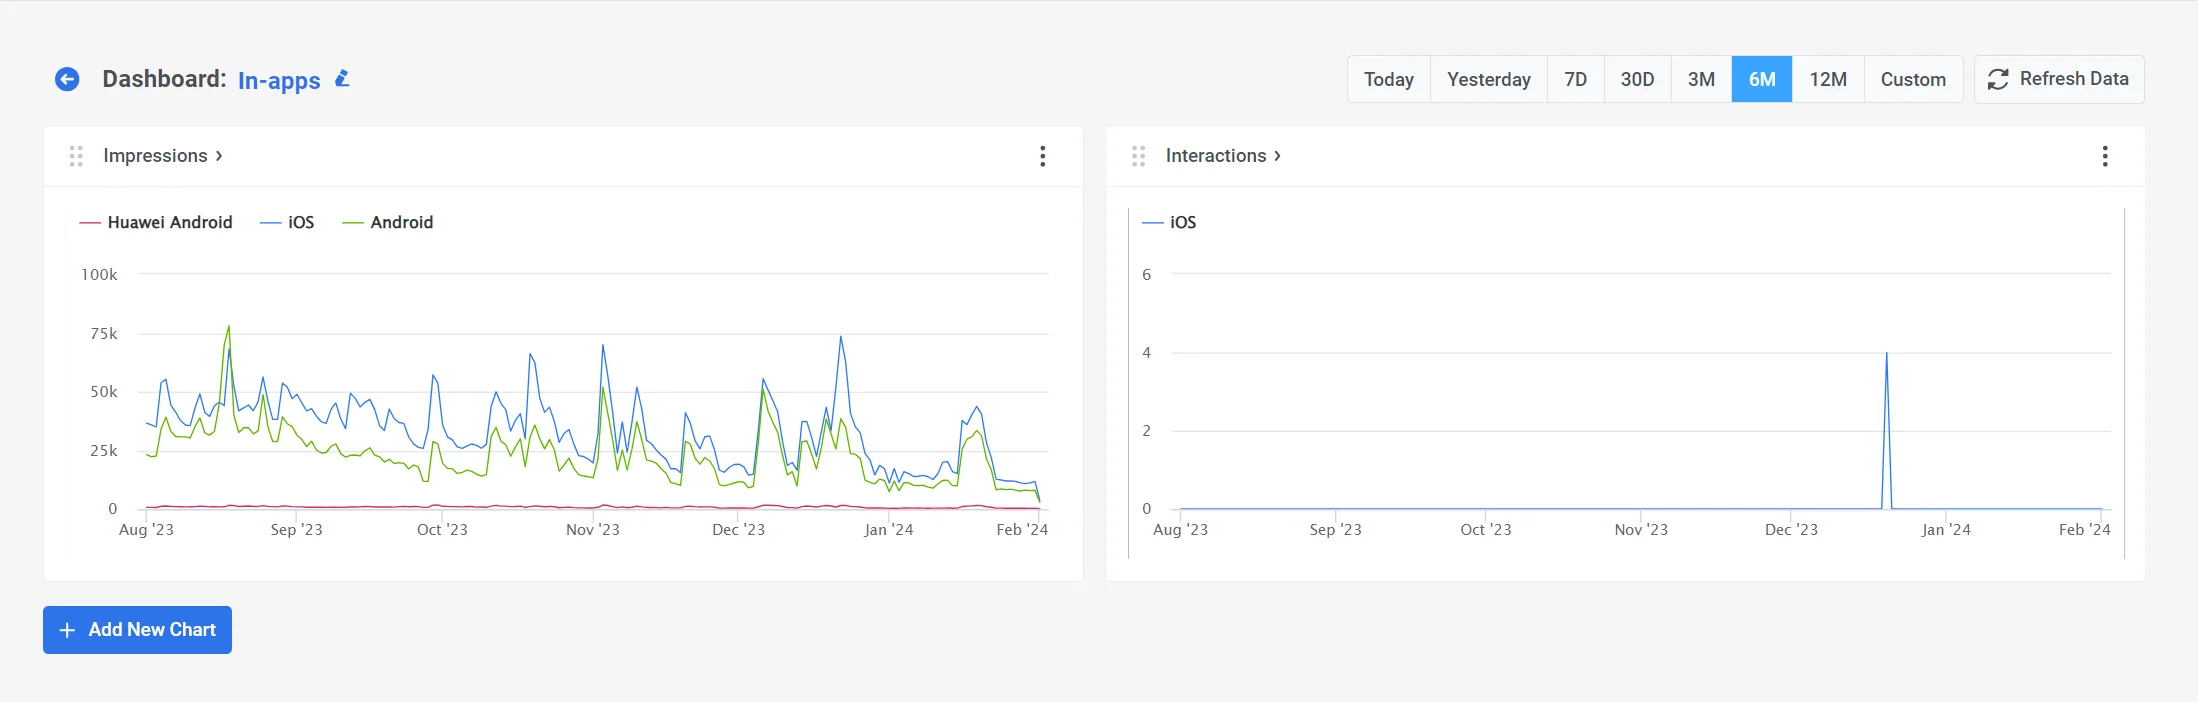
The **In-apps** dashboard provides insights into in-app message performance, featuring metrics like In-app Impressions and Interactions.
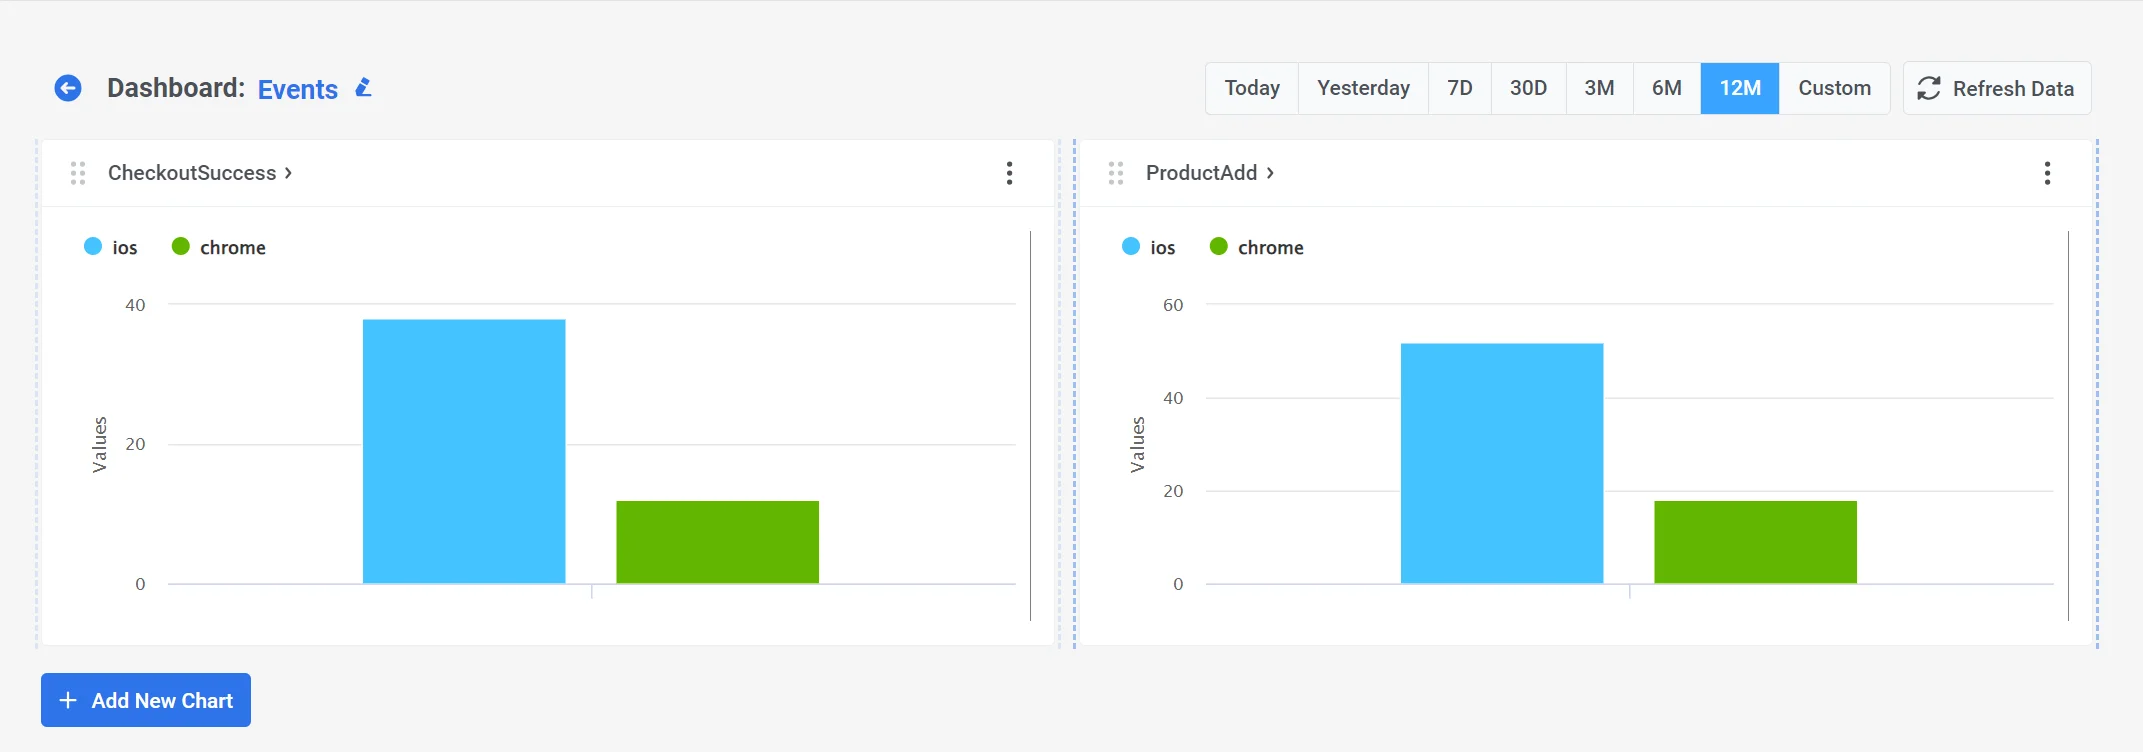
The **Events** dashboard contains statistics related to Events used in your campaigns.
You have the flexibility to customize these dashboards by adding new charts with the metrics you require or removing any that are not relevant to your specific needs.
## How to create a new dashboard
With the Pushwoosh Dashboard Builder, you have the flexibility to create custom dashboards tailored to your specific needs. These dashboards can be built using various data, such as trigger events, communication metrics, audience analytics, etc.
To create a new dashboard, click the **Create Dashboard** button located above the list of your current dashboards.
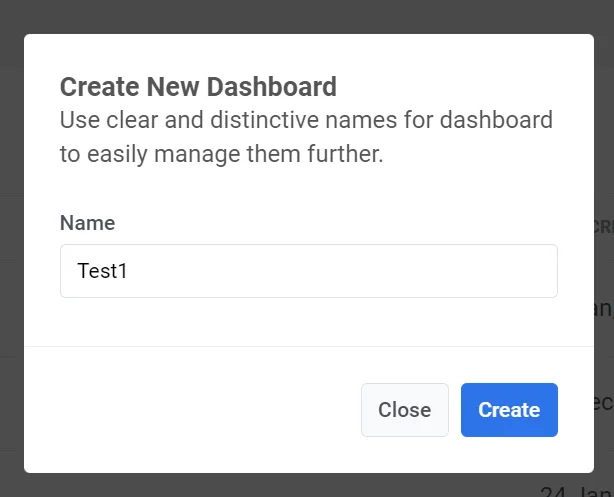
Give your dashboard a clear and descriptive name that reflects its content. This will help you find it later. Don't worry, you can always rename the dashboard later if needed.
Then, click **Create** to proceed.
This will open the Dashboard Builder, where you can create custom dashboards that consist of charts containing all the necessary metrics.
## How to edit dashboards
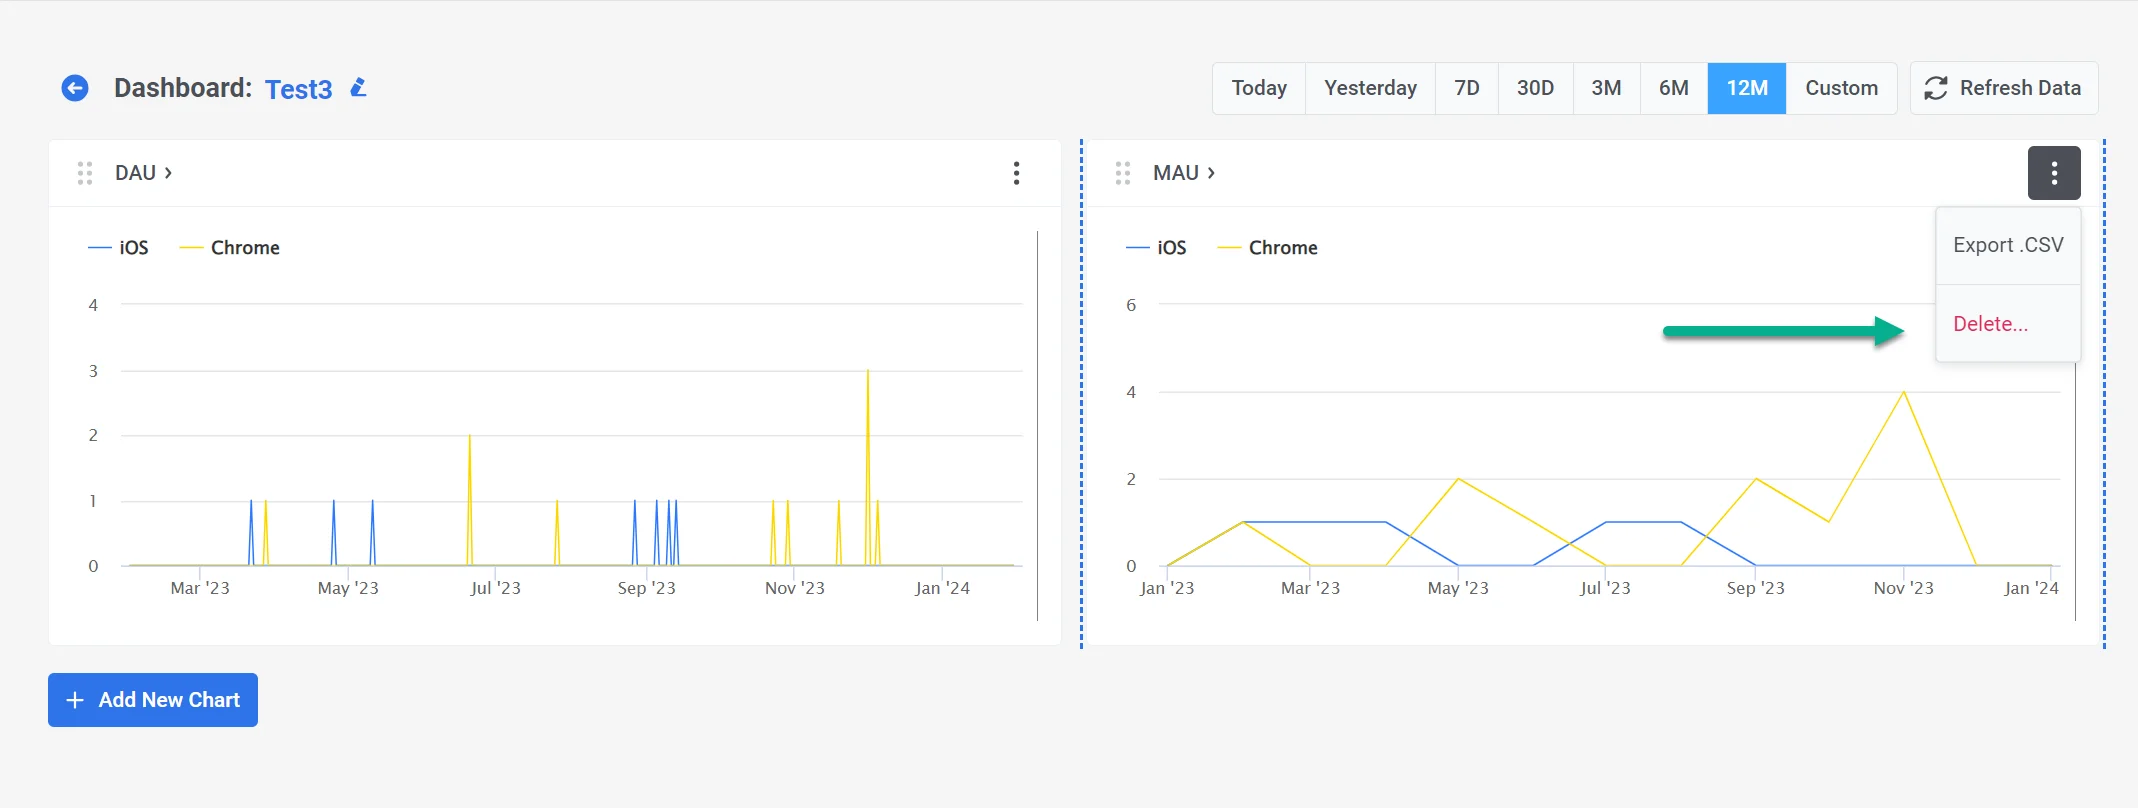
Editing dashboards is simple; you can easily add new charts or delete existing ones. To delete a chart, click on the three dots next to the chart name and select **Delete**.
You can also modify the period displayed in all the charts on the dashboard.
Additionally, the charts are interactive, allowing you to hide data for specific platforms or metrics. To do this, simply click on the platform or metric at the top of the chart, and it will be hidden from view. You can easily bring it back by clicking on the metric again.
You can also adjust the size of the charts for better visibility.
 The **Application** dashboard is designed to help you monitor your app's performance.
 The **Push Notifications** dashboard is designed to help you track how your push notifications campaigns perform.
 The **Emails** dashboard allows you to gauge email campaign effectiveness.
 The **In-apps** dashboard provides insights into in-app message performance, featuring metrics like In-app Impressions and Interactions.
 The **Events** dashboard contains statistics related to Events used in your campaigns.
 You have the flexibility to customize these dashboards by adding new charts with the metrics you require or removing any that are not relevant to your specific needs.
## How to create a new dashboard
With the Pushwoosh Dashboard Builder, you have the flexibility to create custom dashboards tailored to your specific needs. These dashboards can be built using various data, such as trigger events, communication metrics, audience analytics, etc.
To create a new dashboard, click the **Create Dashboard** button located above the list of your current dashboards.
You have the flexibility to customize these dashboards by adding new charts with the metrics you require or removing any that are not relevant to your specific needs.
## How to create a new dashboard
With the Pushwoosh Dashboard Builder, you have the flexibility to create custom dashboards tailored to your specific needs. These dashboards can be built using various data, such as trigger events, communication metrics, audience analytics, etc.
To create a new dashboard, click the **Create Dashboard** button located above the list of your current dashboards.
 Give your dashboard a clear and descriptive name that reflects its content. This will help you find it later. Don't worry, you can always rename the dashboard later if needed.
Then, click **Create** to proceed.
Give your dashboard a clear and descriptive name that reflects its content. This will help you find it later. Don't worry, you can always rename the dashboard later if needed.
Then, click **Create** to proceed.
 This will open the Dashboard Builder, where you can create custom dashboards that consist of charts containing all the necessary metrics.
## How to edit dashboards
Editing dashboards is simple; you can easily add new charts or delete existing ones. To delete a chart, click on the three dots next to the chart name and select **Delete**.
This will open the Dashboard Builder, where you can create custom dashboards that consist of charts containing all the necessary metrics.
## How to edit dashboards
Editing dashboards is simple; you can easily add new charts or delete existing ones. To delete a chart, click on the three dots next to the chart name and select **Delete**.
 You can also modify the period displayed in all the charts on the dashboard.
Additionally, the charts are interactive, allowing you to hide data for specific platforms or metrics. To do this, simply click on the platform or metric at the top of the chart, and it will be hidden from view. You can easily bring it back by clicking on the metric again.
You can also adjust the size of the charts for better visibility.
You can also modify the period displayed in all the charts on the dashboard.
Additionally, the charts are interactive, allowing you to hide data for specific platforms or metrics. To do this, simply click on the platform or metric at the top of the chart, and it will be hidden from view. You can easily bring it back by clicking on the metric again.
You can also adjust the size of the charts for better visibility.