# Refine analytics with filters
## Understanding filters
Dashboard filters allow you to narrow down the data you see by specifying certain conditions. For example,
you can filter by platform (like iOS or Android), by specific campaigns, or by user segments.
This helps you focus on the data that matters most to you, excluding any irrelevant information.
## Applying filters
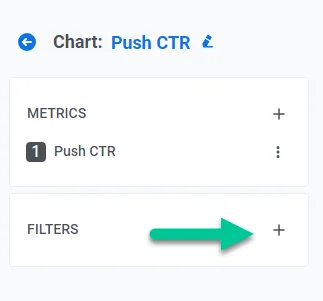
To add filters, first click on the **Plus icon** in the **Filters** section.
Then, select a filter from the list of filter options, including:
* **Platforms:** Filter data by different platforms such as iOS, Android, Baidu, Huawei, etc.
* **Push:** Filter out metrics and events achieved with specific push notification(s).
* **Email:** Filter out metrics and events achieved with specific email(s).
* **Campaigns:** Filter data by different campaigns (journeys).
* **Aggregated Messages:** Filter different aggregated messages.
* **Segment:** Filter metrics from the Communications and Events metric groups for users in the selected segments.
### Platforms
This filter allows you to focus on data from specific platforms, such as iOS, Android, Baidu, Huawei, and others.
It helps you understand metrics on different devices and operating systems, enabling you to
optimize your communication strategies accordingly.
**Applicable to:** all metrics except DAU, MAU, and Finance metrics
### Push
This filter enables you to analyze the performance of individual push messages. You can track key metrics such as
delivery rate, open rate, and user interactions for each notification. This helps in identifying which push
notifications resonate most with your audience, allowing for more targeted and effective messaging in the future.
**Applicable to:** communication metrics and events
### Emails
Use this filter to examine the performance of specific email campaigns. It provides insights into open rates,
click-through rates, and conversion metrics, helping you evaluate the success of your email marketing strategies.
You can also compare different email campaigns to determine which content and subject lines are most effective.
**Applicable to:** communication metrics
### Campaigns
This filter allows you to analyze data for specific campaigns, which can include multiple types of communications
(e.g., push notifications, emails, in-app messages). Campaigns help you track user interactions across a sequence
of messages designed for a particular goal, such as onboarding, retention, or re-engagement.
**Applicable to:** finance metrics, communication metrics, and events
### Aggregated Messages
This filter provides an overall view of messaging performance by aggregating statistics from multiple communications.
Unlike campaigns, which focus on structured message sequences, aggregated messages give a high-level summary of all
sent communications within a selected timeframe. This helps in assessing the overall reach and engagement of messaging efforts.
**Applicable to:** communication metrics and events
### Segment
This filter allows you to narrow down data by predefined audience segments. These segments can be based on user behavior,
demographics, or other custom attributes. By applying this filter, you can better understand how different groups of
users engage with your content, helping you to tailor your messaging strategies to meet the unique needs of each segment.
**Applicable to:** communication metrics and events
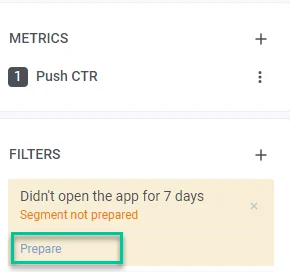
> _Before creating a chart with the **Segment** filter, ensure that you've recalculated the segment to obtain the most current data. To do this, click on **Prepare**. Please note that actual data cannot be displayed if the selected segment is not prepared._
## Examples of using filters
### Compare metrics of different journeys
With Dashboard Filters, you can compare the performance of different journeys using various metrics, both overall and for selected messages.
For example, if you want to compare the push notification click-through rates (CTR) of two different journeys, follow these steps:
1. In the **Metrics** section, select **Communication - Push CTR**.
2. In the **Filters** section, select **Campaigns**. Choose the journeys you need from the list of customer journeys that opens. You can choose the entire journey or specific messages.
3. Click **Apply**.
### Measure the impact of your campaigns on user-triggered events
To understand how your communication efforts correlate with specific events triggered as a result of a campaign and to measure the impact of your messages on user actions, follow these steps:
1. In the **Metrics** section, select **Communication - Push sends.**
2. Choose the target event in **Communication - Events.**
3. Filter the data by the campaign you want to track.
4. Click **Apply**.
### Compare metrics for different segments
Dashboard filters allow you to analyze how various user segments respond to your push notifications. Insights from this analysis enable you to customize your strategies for specific groups.
For example, to compare CTRs of push notifications sent to new users vs all users, follow these steps:
1. In the **Metrics** section, select **Communication - Push CTR**
2. In the **Filters** section, choose **Push** and select the specific push message for analysis.
3. In the **Filters** section, select **Segment** and choose a user segment from the list.
4. Click **Apply**.
 Then, select a filter from the list of filter options, including:
* **Platforms:** Filter data by different platforms such as iOS, Android, Baidu, Huawei, etc.
* **Push:** Filter out metrics and events achieved with specific push notification(s).
* **Email:** Filter out metrics and events achieved with specific email(s).
* **Campaigns:** Filter data by different campaigns (journeys).
* **Aggregated Messages:** Filter different aggregated messages.
* **Segment:** Filter metrics from the Communications and Events metric groups for users in the selected segments.
### Platforms
This filter allows you to focus on data from specific platforms, such as iOS, Android, Baidu, Huawei, and others.
It helps you understand metrics on different devices and operating systems, enabling you to
optimize your communication strategies accordingly.
**Applicable to:** all metrics except DAU, MAU, and Finance metrics
### Push
This filter enables you to analyze the performance of individual push messages. You can track key metrics such as
delivery rate, open rate, and user interactions for each notification. This helps in identifying which push
notifications resonate most with your audience, allowing for more targeted and effective messaging in the future.
**Applicable to:** communication metrics and events
### Emails
Use this filter to examine the performance of specific email campaigns. It provides insights into open rates,
click-through rates, and conversion metrics, helping you evaluate the success of your email marketing strategies.
You can also compare different email campaigns to determine which content and subject lines are most effective.
**Applicable to:** communication metrics
### Campaigns
This filter allows you to analyze data for specific campaigns, which can include multiple types of communications
(e.g., push notifications, emails, in-app messages). Campaigns help you track user interactions across a sequence
of messages designed for a particular goal, such as onboarding, retention, or re-engagement.
**Applicable to:** finance metrics, communication metrics, and events
### Aggregated Messages
This filter provides an overall view of messaging performance by aggregating statistics from multiple communications.
Unlike campaigns, which focus on structured message sequences, aggregated messages give a high-level summary of all
sent communications within a selected timeframe. This helps in assessing the overall reach and engagement of messaging efforts.
**Applicable to:** communication metrics and events
### Segment
This filter allows you to narrow down data by predefined audience segments. These segments can be based on user behavior,
demographics, or other custom attributes. By applying this filter, you can better understand how different groups of
users engage with your content, helping you to tailor your messaging strategies to meet the unique needs of each segment.
**Applicable to:** communication metrics and events
> _Before creating a chart with the **Segment** filter, ensure that you've recalculated the segment to obtain the most current data. To do this, click on **Prepare**. Please note that actual data cannot be displayed if the selected segment is not prepared._
Then, select a filter from the list of filter options, including:
* **Platforms:** Filter data by different platforms such as iOS, Android, Baidu, Huawei, etc.
* **Push:** Filter out metrics and events achieved with specific push notification(s).
* **Email:** Filter out metrics and events achieved with specific email(s).
* **Campaigns:** Filter data by different campaigns (journeys).
* **Aggregated Messages:** Filter different aggregated messages.
* **Segment:** Filter metrics from the Communications and Events metric groups for users in the selected segments.
### Platforms
This filter allows you to focus on data from specific platforms, such as iOS, Android, Baidu, Huawei, and others.
It helps you understand metrics on different devices and operating systems, enabling you to
optimize your communication strategies accordingly.
**Applicable to:** all metrics except DAU, MAU, and Finance metrics
### Push
This filter enables you to analyze the performance of individual push messages. You can track key metrics such as
delivery rate, open rate, and user interactions for each notification. This helps in identifying which push
notifications resonate most with your audience, allowing for more targeted and effective messaging in the future.
**Applicable to:** communication metrics and events
### Emails
Use this filter to examine the performance of specific email campaigns. It provides insights into open rates,
click-through rates, and conversion metrics, helping you evaluate the success of your email marketing strategies.
You can also compare different email campaigns to determine which content and subject lines are most effective.
**Applicable to:** communication metrics
### Campaigns
This filter allows you to analyze data for specific campaigns, which can include multiple types of communications
(e.g., push notifications, emails, in-app messages). Campaigns help you track user interactions across a sequence
of messages designed for a particular goal, such as onboarding, retention, or re-engagement.
**Applicable to:** finance metrics, communication metrics, and events
### Aggregated Messages
This filter provides an overall view of messaging performance by aggregating statistics from multiple communications.
Unlike campaigns, which focus on structured message sequences, aggregated messages give a high-level summary of all
sent communications within a selected timeframe. This helps in assessing the overall reach and engagement of messaging efforts.
**Applicable to:** communication metrics and events
### Segment
This filter allows you to narrow down data by predefined audience segments. These segments can be based on user behavior,
demographics, or other custom attributes. By applying this filter, you can better understand how different groups of
users engage with your content, helping you to tailor your messaging strategies to meet the unique needs of each segment.
**Applicable to:** communication metrics and events
> _Before creating a chart with the **Segment** filter, ensure that you've recalculated the segment to obtain the most current data. To do this, click on **Prepare**. Please note that actual data cannot be displayed if the selected segment is not prepared._
 ## Examples of using filters
### Compare metrics of different journeys
With Dashboard Filters, you can compare the performance of different journeys using various metrics, both overall and for selected messages.
For example, if you want to compare the push notification click-through rates (CTR) of two different journeys, follow these steps:
1. In the **Metrics** section, select **Communication - Push CTR**.
2. In the **Filters** section, select **Campaigns**. Choose the journeys you need from the list of customer journeys that opens. You can choose the entire journey or specific messages.
3. Click **Apply**.
### Measure the impact of your campaigns on user-triggered events
To understand how your communication efforts correlate with specific events triggered as a result of a campaign and to measure the impact of your messages on user actions, follow these steps:
1. In the **Metrics** section, select **Communication - Push sends.**
2. Choose the target event in **Communication - Events.**
3. Filter the data by the campaign you want to track.
4. Click **Apply**.
### Compare metrics for different segments
Dashboard filters allow you to analyze how various user segments respond to your push notifications. Insights from this analysis enable you to customize your strategies for specific groups.
For example, to compare CTRs of push notifications sent to new users vs all users, follow these steps:
1. In the **Metrics** section, select **Communication - Push CTR**
2. In the **Filters** section, choose **Push** and select the specific push message for analysis.
3. In the **Filters** section, select **Segment** and choose a user segment from the list.
4. Click **Apply**.
## Examples of using filters
### Compare metrics of different journeys
With Dashboard Filters, you can compare the performance of different journeys using various metrics, both overall and for selected messages.
For example, if you want to compare the push notification click-through rates (CTR) of two different journeys, follow these steps:
1. In the **Metrics** section, select **Communication - Push CTR**.
2. In the **Filters** section, select **Campaigns**. Choose the journeys you need from the list of customer journeys that opens. You can choose the entire journey or specific messages.
3. Click **Apply**.
### Measure the impact of your campaigns on user-triggered events
To understand how your communication efforts correlate with specific events triggered as a result of a campaign and to measure the impact of your messages on user actions, follow these steps:
1. In the **Metrics** section, select **Communication - Push sends.**
2. Choose the target event in **Communication - Events.**
3. Filter the data by the campaign you want to track.
4. Click **Apply**.
### Compare metrics for different segments
Dashboard filters allow you to analyze how various user segments respond to your push notifications. Insights from this analysis enable you to customize your strategies for specific groups.
For example, to compare CTRs of push notifications sent to new users vs all users, follow these steps:
1. In the **Metrics** section, select **Communication - Push CTR**
2. In the **Filters** section, choose **Push** and select the specific push message for analysis.
3. In the **Filters** section, select **Segment** and choose a user segment from the list.
4. Click **Apply**.