Building and managing charts in dashboards
How to build a chart
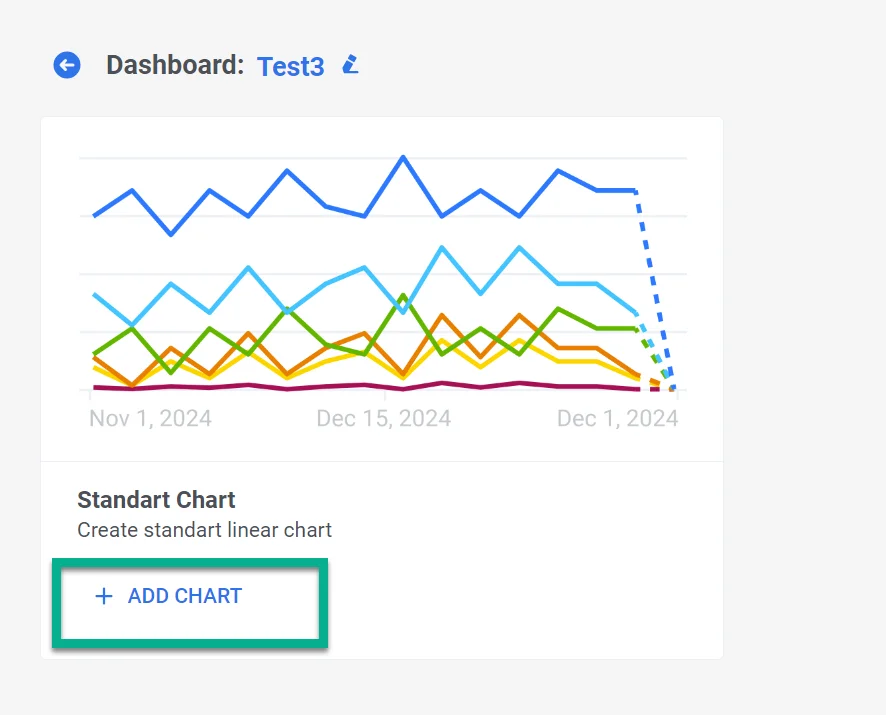
Anchor link toEach dashboard contains charts displaying various metrics, which enables you to gain a comprehensive insight into your campaign and application performance. A dashboard can have up to 10 charts.
- To add a chart, click Add Chart in the Dashboard Builder.
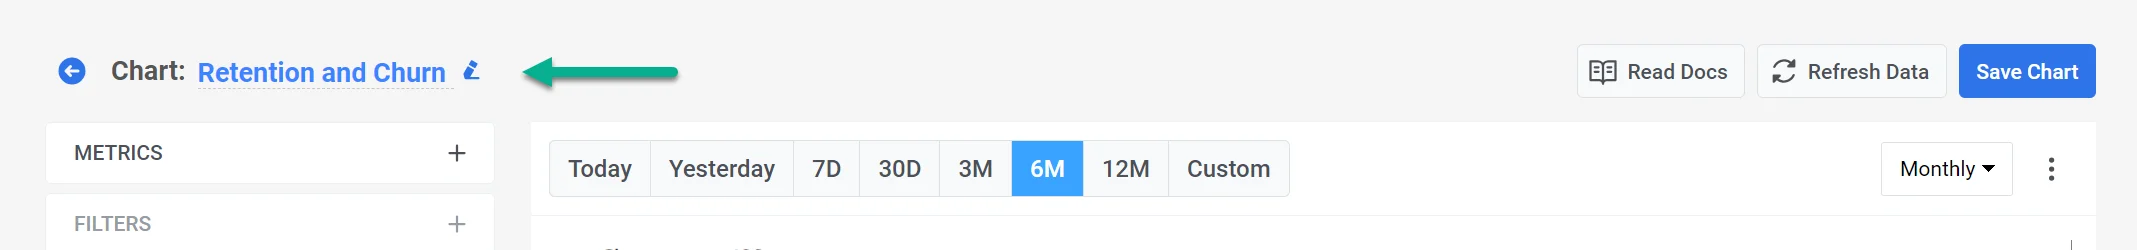
- In the Chart Widget that opens, provide a descriptive and clear chart name that accurately represents the data it contains. You can always edit the chart name later if necessary.
Selecting metrics
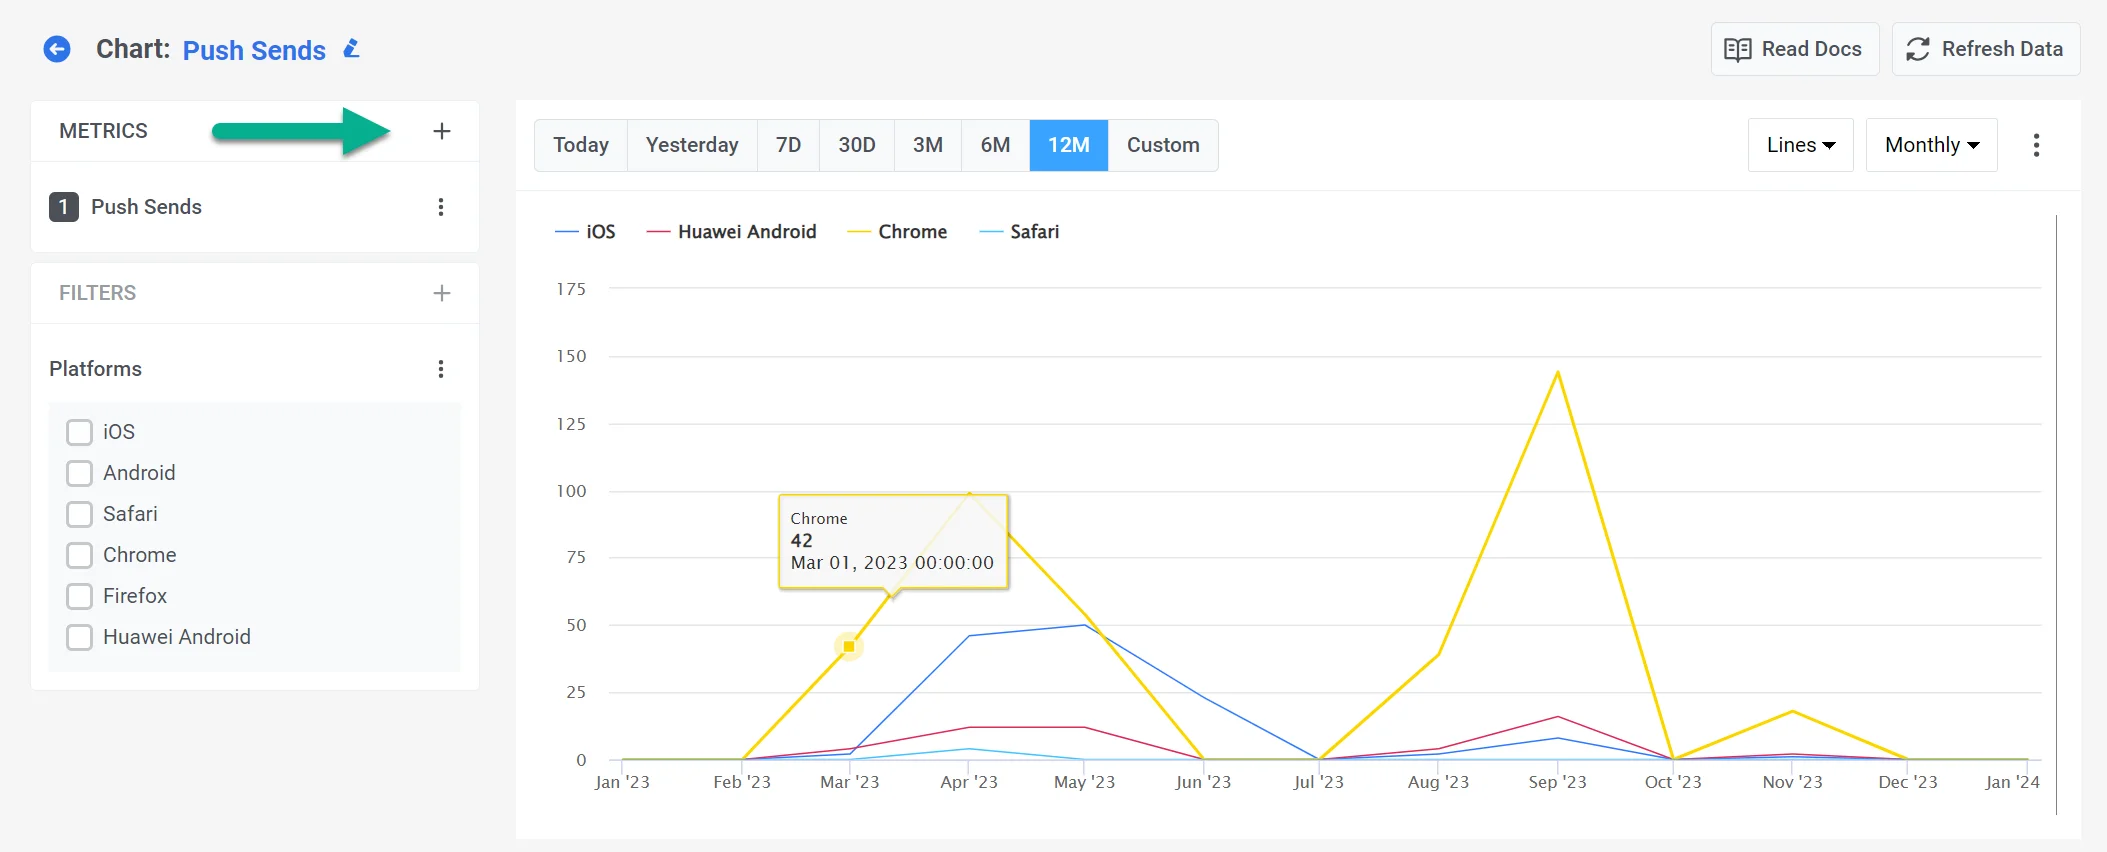
Anchor link toIn the Metrics section, choose the specific metrics you need to monitor. You can select up to five metrics to display in a single chart. This allows for a comprehensive view of multiple data points simultaneously.
All the metrics available are divided into three main groups:
- Communication Metrics that offer insights into the performance of various communication channels. Learn more
- Audience Metrics that provide insights into your application’s audience. Learn more
- Events Metrics that allow you to understand user behavior by examining event-related metrics. Learn more
- Tags Metrics that allow you to understand the reach and distribution of tags across your user base Learn more
You can mix and match metrics from different groups to tailor your chart to your needs.
Visualization
Anchor link toDashboard Builder supports several types of visualizations, including:
- Lines – Ideal for trend analysis over time.
- Bars – Useful for comparing values across categories.
- Pie – Best for displaying percentage breakdowns.
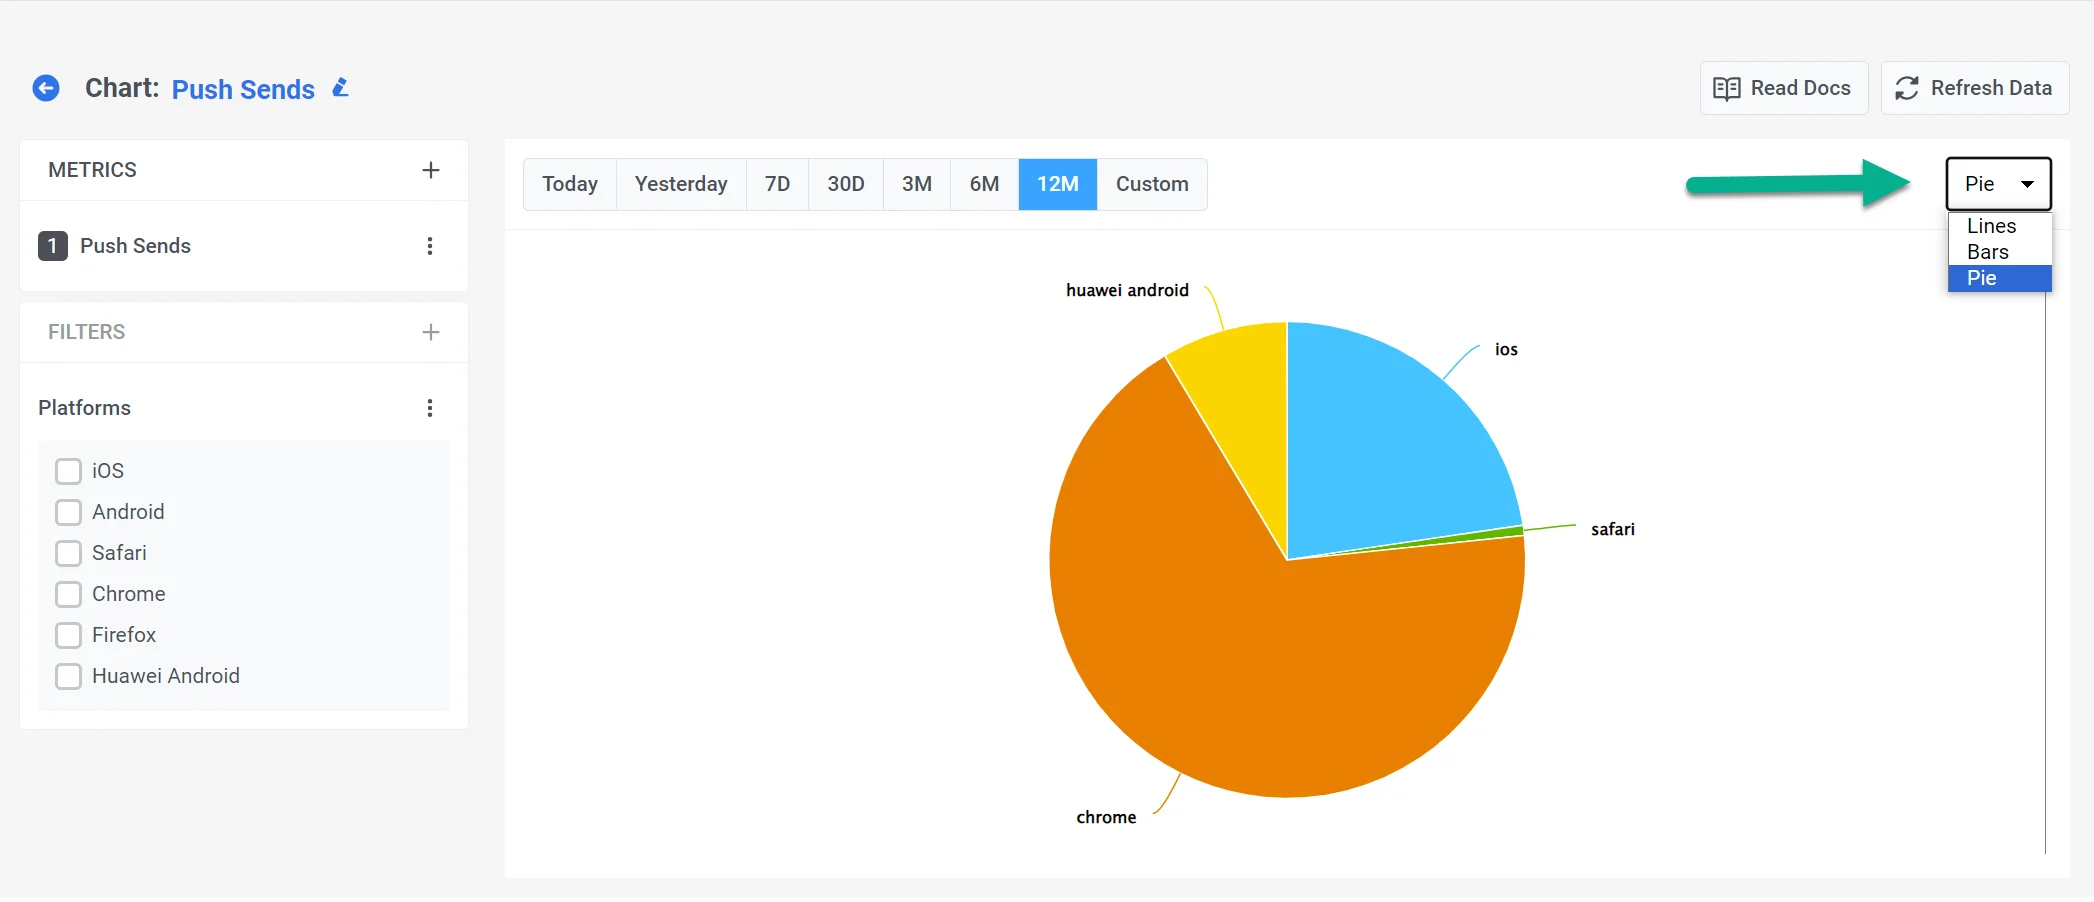
At the top of the page, specify the period or set a custom period. You can also specify the interval at which your data is displayed: Daily or Hourly for periods up to 30 days and Daily or Monthly for longer periods.
For a more in-depth analysis of your data, refer to the Filters and Breakdowns sections.
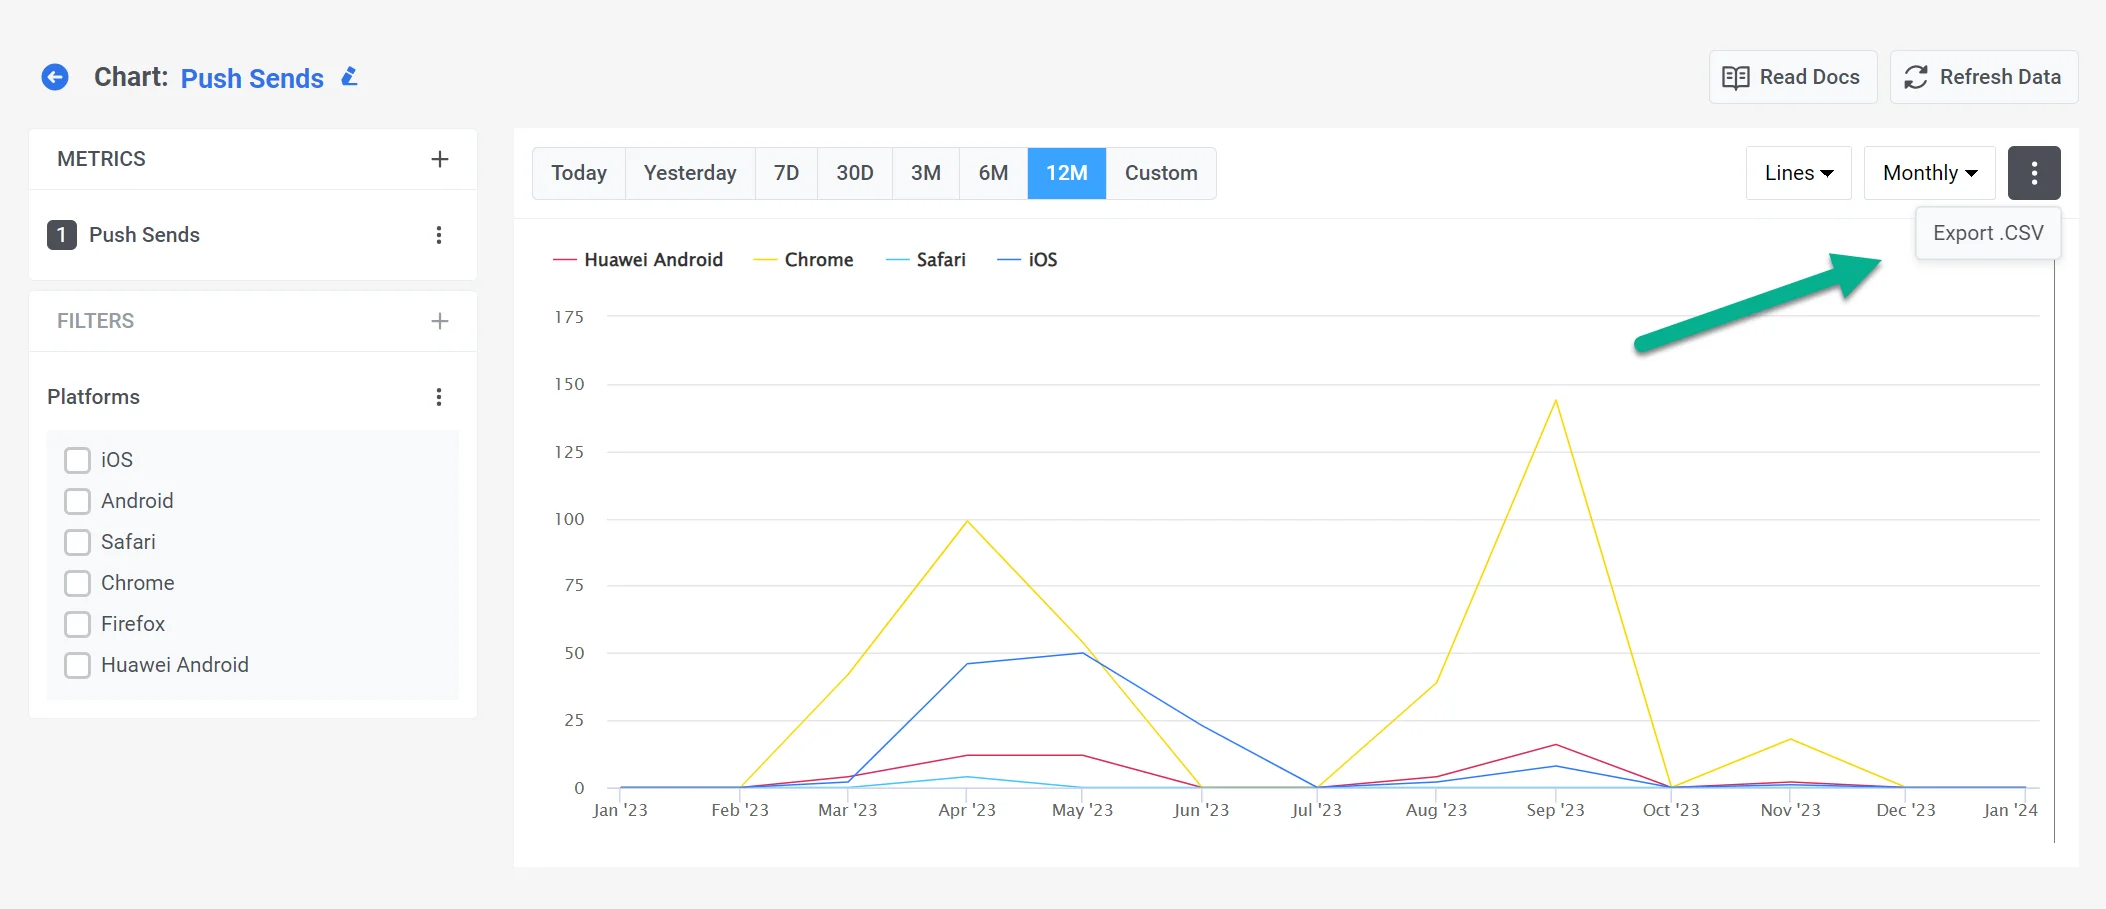
Exporting data
Anchor link toYou can also export your chart as a CSV file. To do this, click on the three dots in the upper right corner of the report.