User retention statistics
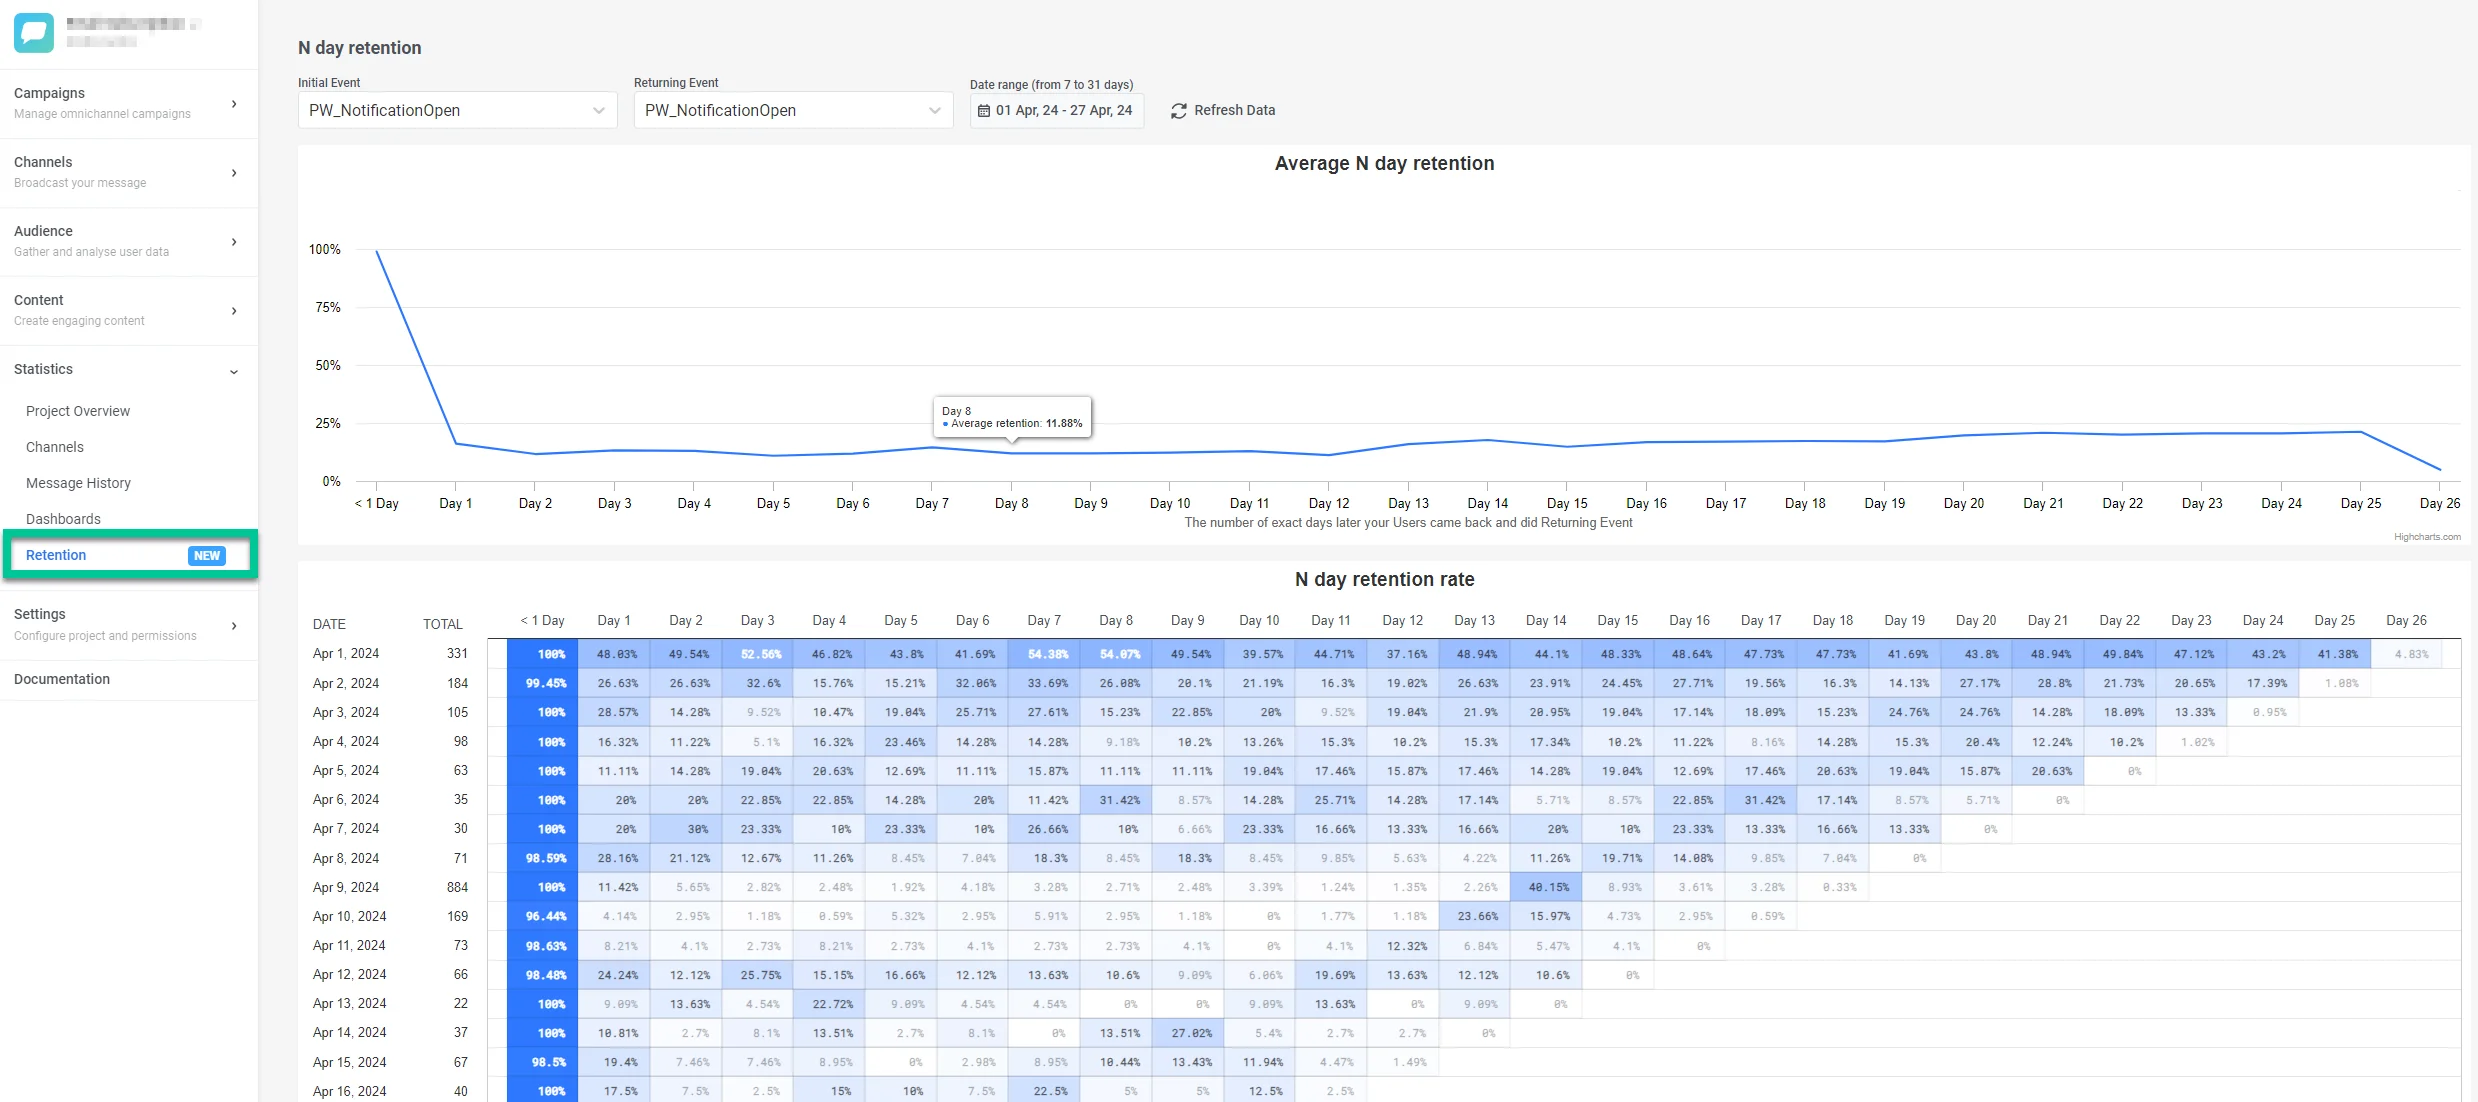
The Retention tab in Pushwoosh helps you understand how users interact with your app over time. By tracking retention to specific actions or events relevant to your business, you can gauge the effectiveness of your communication strategies.
To analyze user retention data, navigate to Statistics > Retention in your Pushwoosh account.

How to analyze retention data
Anchor link toSelecting events
Anchor link toThe first step involves defining user actions or events that signify activity and engagement. They will be used to build the retention graph.
- Choose the event that marks the starting point for tracking retention. This could be an event like ProductAdd (adding a product to a cart) or Account Registered.
- Select the returning or subsequent action that indicates a user’s return and continued engagement. For example, it can be CheckoutSuccess (completing a purchase) or App Open (opening the app).
Example: To understand how effectively your app converts users who add products to their cart into loyal customers, set ProductAdd as the initial event and CheckoutSuccess as the returning event. This will help you identify drop-off points and optimize the user journey to maximize retention.
Setting the date range
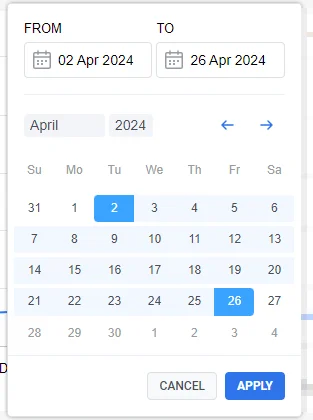
Anchor link toSpecify the time frame for which you want to analyze user retention data. By default, Pushwoosh stores event data for one year, however, if you need longer storage, contact Pushwoosh sales.

Understanding the User Retention Graph
Anchor link toThe Retention Graph (also known as User Retention Curve) is a visual representation of user retention over time. It displays the average retention rate for the chosen date range. The graph shows how many days, on average, users wait before performing the returning event after the initial event. Learn more about the User Retention Curve and how to flatten it

Detailed Retention Data table
Anchor link toBelow the graph, a detailed table breaks down user retention rates for each day within the date range. Columns display the total number of users within a cohort and the retention rate for each day following the initial event (e.g., Day 1, Day 2, etc.).

Refreshing data
Anchor link toClick Refresh Data to ensure you’re viewing the most up-to-date information.

Use cases
Anchor link toHere are some common use cases for analyzing user retention in Pushwoosh:
Basic app retention
Anchor link toGoal: Measure how long your audience stays with you.
Initial Event: PW_DeviceRegistered
Returning Event: PW_ApplicationOpen
Analysis: This combination shows how many users who register actually return and use the app. A declining retention rate after registration might indicate issues with onboarding or a lack of value proposition.
App value retention (e.g., Fitness apps)
Anchor link toGoal: Evaluate if users complete a valuable action in your app—in our example, exercise regularly.
Initial Event: Workout Complete
Returning Event: Workout Complete
Analysis: To track how consistently users complete workouts over time, you can mark Workout Complete as both the initial and returning event. If the retention rate is low, it may indicate a need to revamp the app’s engagement strategies. This can be achieved by optimizing motivational notifications to boost user activity.
Content engagement
Anchor link toGoal: Evaluate the duration for which the new audience remains engaged with your content.
Initial Event: Notification Open (when a user opens a push notification or email)
Returning Event: Notification Open (when a user opens another push notification or email)
Analysis: The retention graph will show the percentage of users who open subsequent push notifications or emails after opening an initial one. This helps you determine if your content is interesting enough to keep users engaged over time.
To learn how to set up a retention campaign in Pushwoosh, read this guide