Email statistics
In Pushwoosh, email analytics provide valuable insights into the performance of your messages. You can evaluate individual email performance and track overall trends across your email campaigns.
Track individual email message performance
Anchor link toYou can monitor the performance of each email message within a customer journey directly on the Journey canvas.
To view statistics for a message, enable Show Metrics at the bottom of the canvas, or hover over the message element to see the stats.
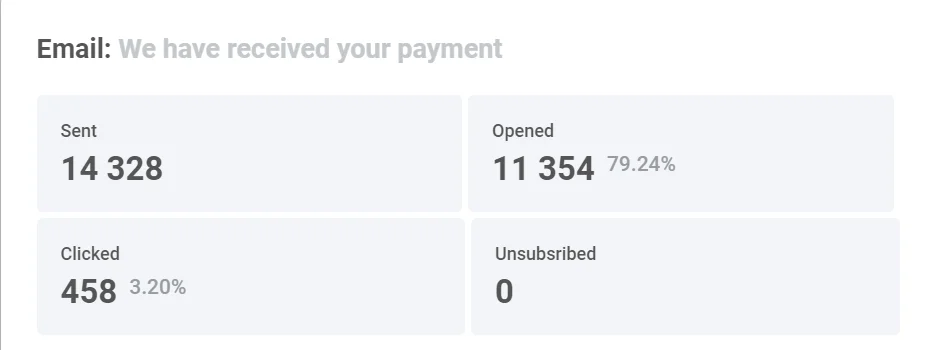
Below the email message element, you will see such metrics as:
| Goals Reached | Indicates the number of users who reached the Conversion Goal at this specific point. |
| Opened | Number and percentage of unique users who opened the email (each user counted once). |
| CTR | Represents the percentage of users who clicked on the message. |
| Drop-offs | Represents the number of messages that couldn’t be sent. |
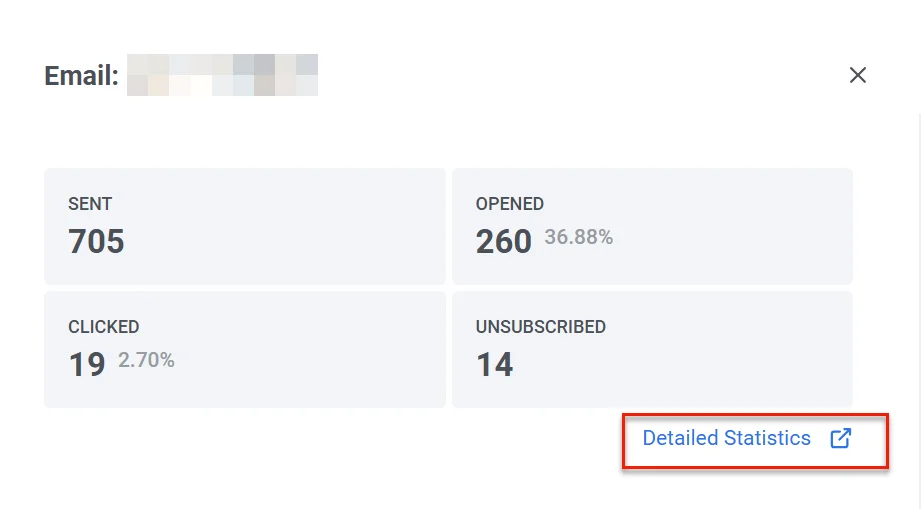
For a detailed view of individual message effectiveness, double-click on a message element on the canvas. A statistics window will pop up, displaying key metrics, such as:
- Number of sent messages
- Number of opened messages
- Number of clicks
- Number of recipients who have unsubscribed
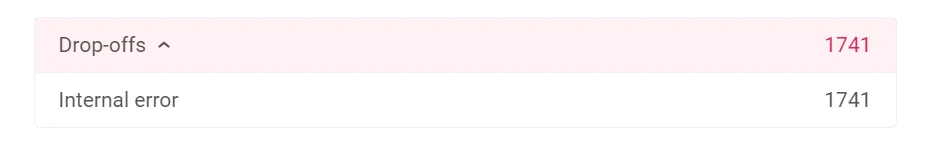
To see the reasons for drop-offs and the number of drop-offs for each cause, expand the Drop-offs block.
Detailed email statistics
Anchor link toTo view detailed statistics for an email message, click Detailed Statistics in the journey email element. Alternatively, access them through Campaigns → One-time messages. Locate the message you need and click on it.
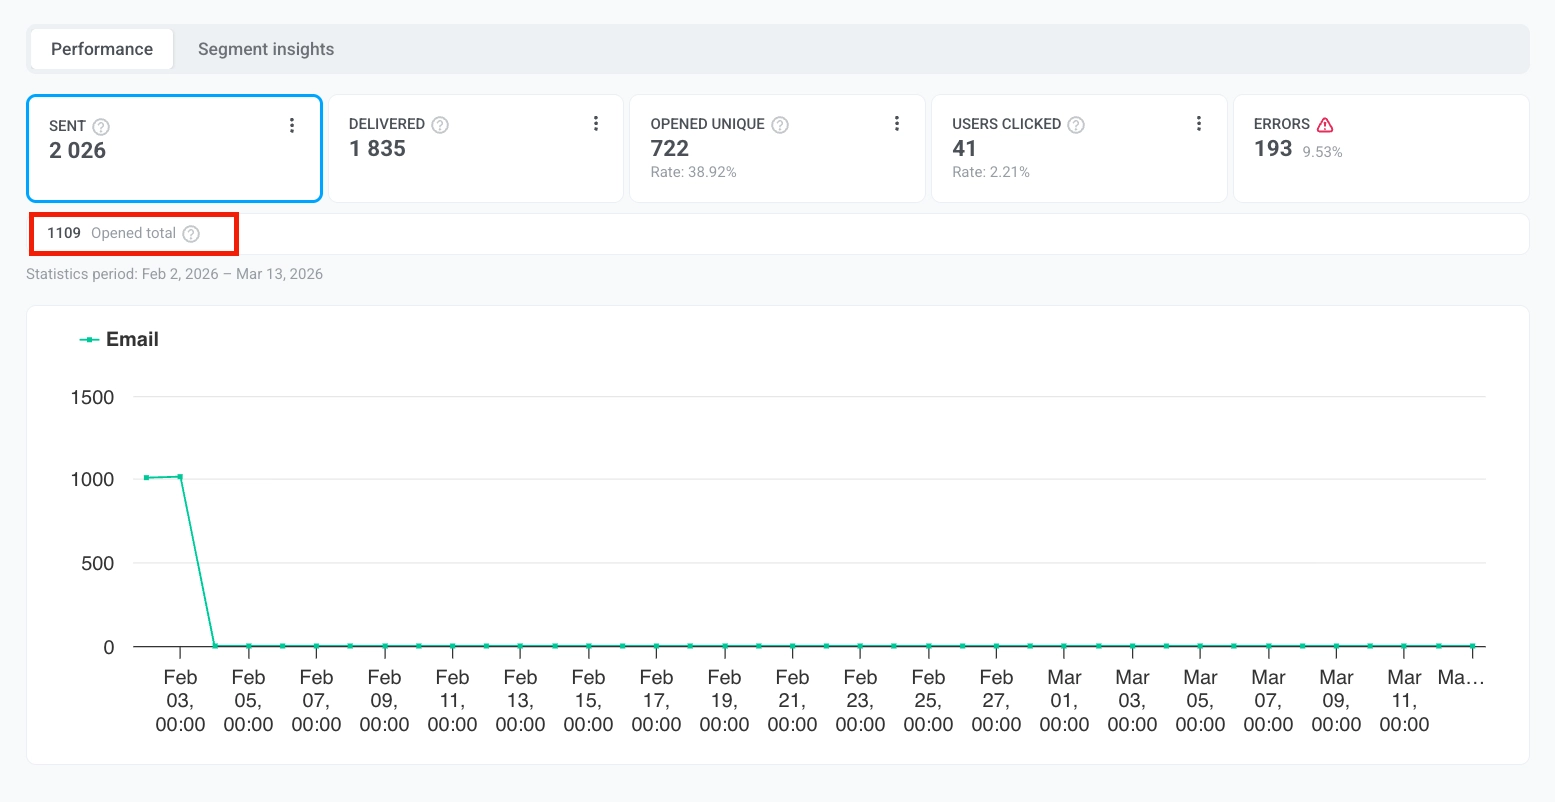
The Email statistics section provides detailed insights into the performance of your email campaigns, helping you evaluate their effectiveness and refine your strategy.
This section includes:
- Performance tab: Displays essential metrics such as Sent, Delivered, Opened unique, Opened total, Users clicked, and Errors. It also features a dynamic graph that shows trends for each metric over time, allowing you to track campaign performance within a specific date range and gain deeper insights into your email campaigns.
- Segment insights tab: Provides performance metrics for each audience segment targeted in your email campaigns.

Pick a date range
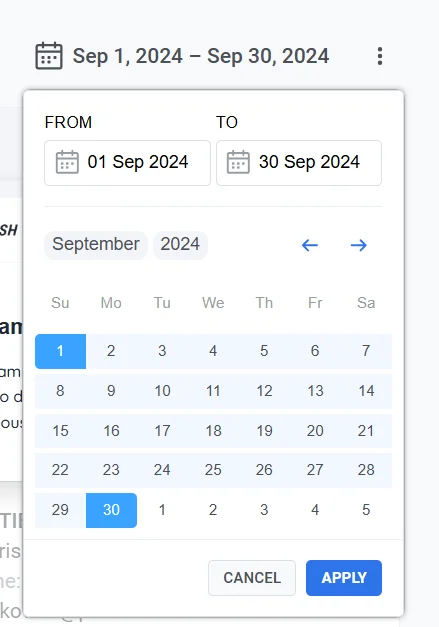
Anchor link toBy default, if no custom range is selected, the Email Statistics section adjusts its data display based on the specific time frame of each metric. For example, for the Sent metric, data is shown from the first to the last send, for Opened unique and Opened total, it reflects the period from the first to the last open, etc. To view statistics for a specific period:
- Click Pick date range.
- Select your desired start and end dates
- Click Apply.
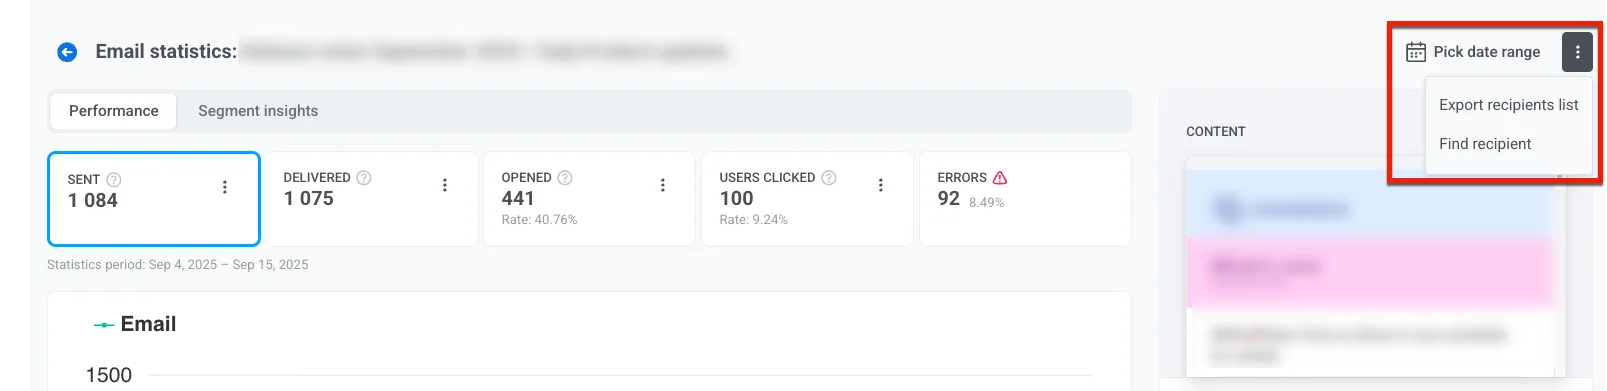
Export recipients list
Anchor link toYou can download detailed data about the recipients of your email campaign. This data can be used for further analysis or segmentation to optimize future campaigns.
To export the recipients list:
- In the Email Statistics section, click the three-dot menu (⋮) at the top.
- From the dropdown menu, select Export recipients list.
- When the export is complete, a notification will appear with a Download CSV button. Click the button to download the recipient data in CSV format.
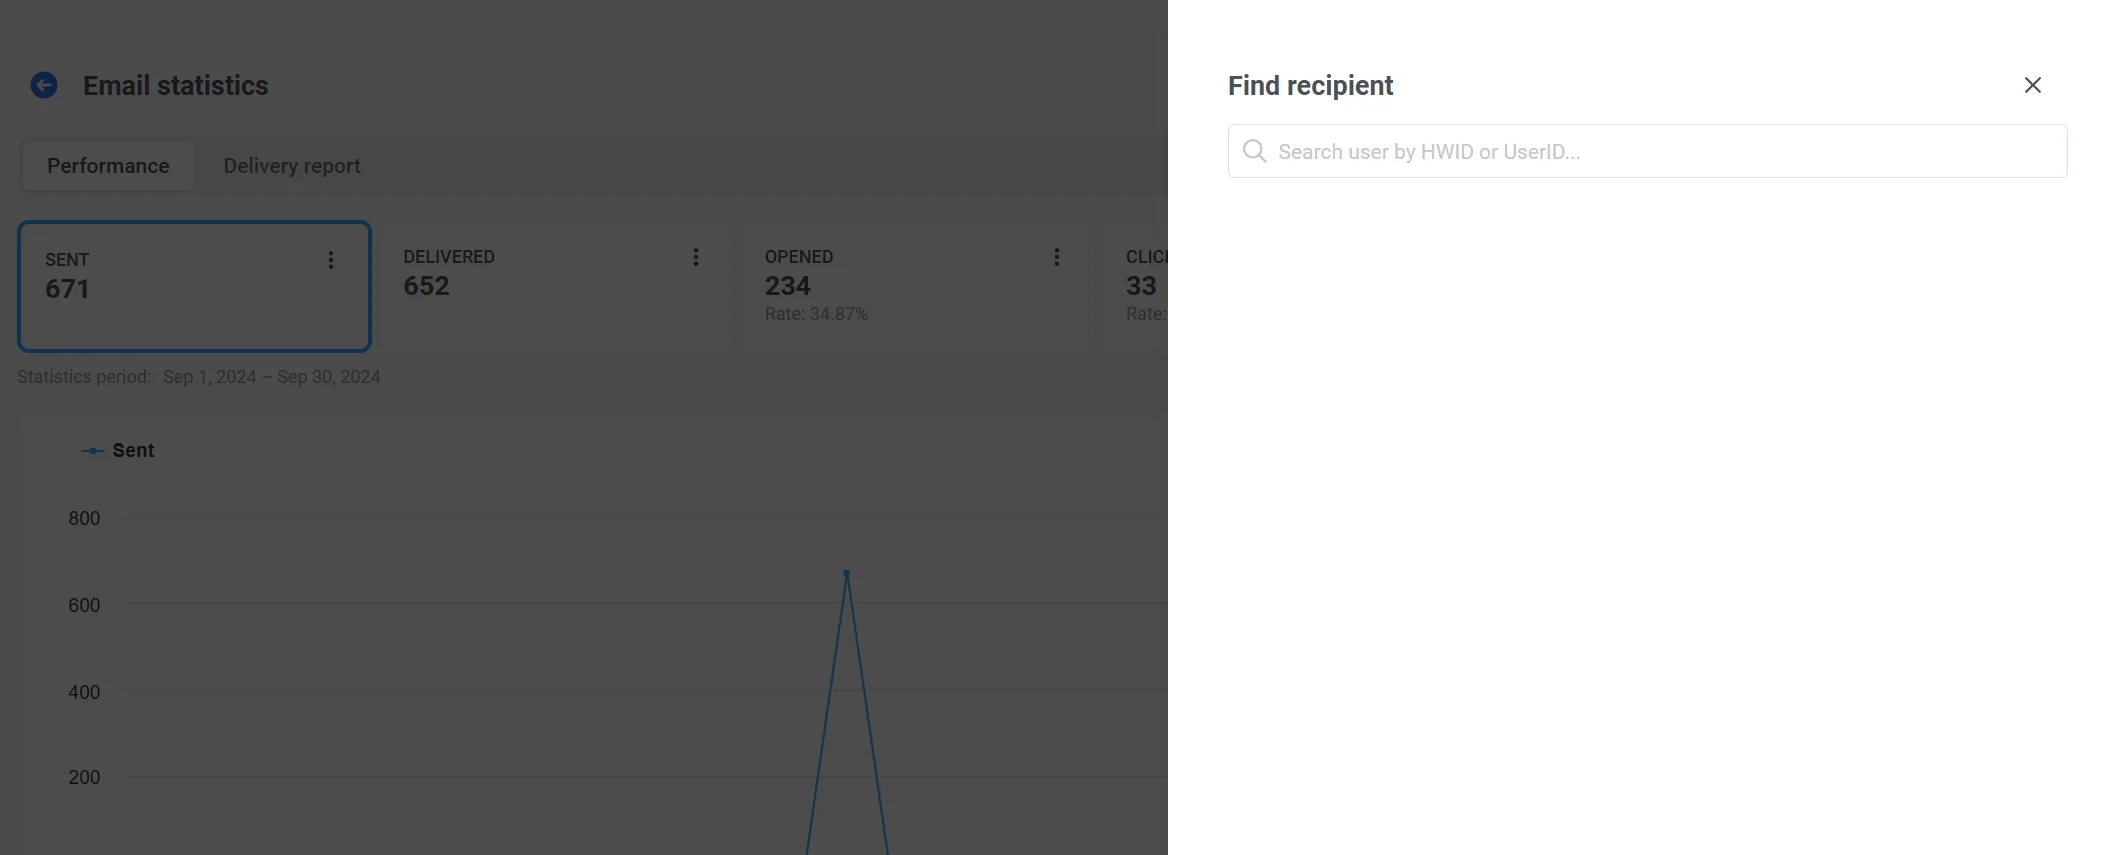
Find a specific recipient
Anchor link toUse the Find recipient option to search for a specific user within the campaign.
For this:
- In the Performance tab, click the three-dot menu.
- Select Find recipient from the dropdown menu.
- Search the recipient by HWID or UserID
Performance tab
Anchor link toThe Performance tab provides an in-depth analysis of your messaging campaign metrics, helping you evaluate performance, engagement, and delivery trends over time. Use this data to optimize your messaging strategy and improve results.
Here, you can find such metrics as Sent, Delivered, Opened unique, Opened total, and Users clicked, along with a dynamic graph that visualizes the trends for each metric.
Sent
Anchor link toThe Sent metric provides the number of messages sent over a selected time period. Use these insights to fine-tune the timing and frequency of your campaigns to improve performance.
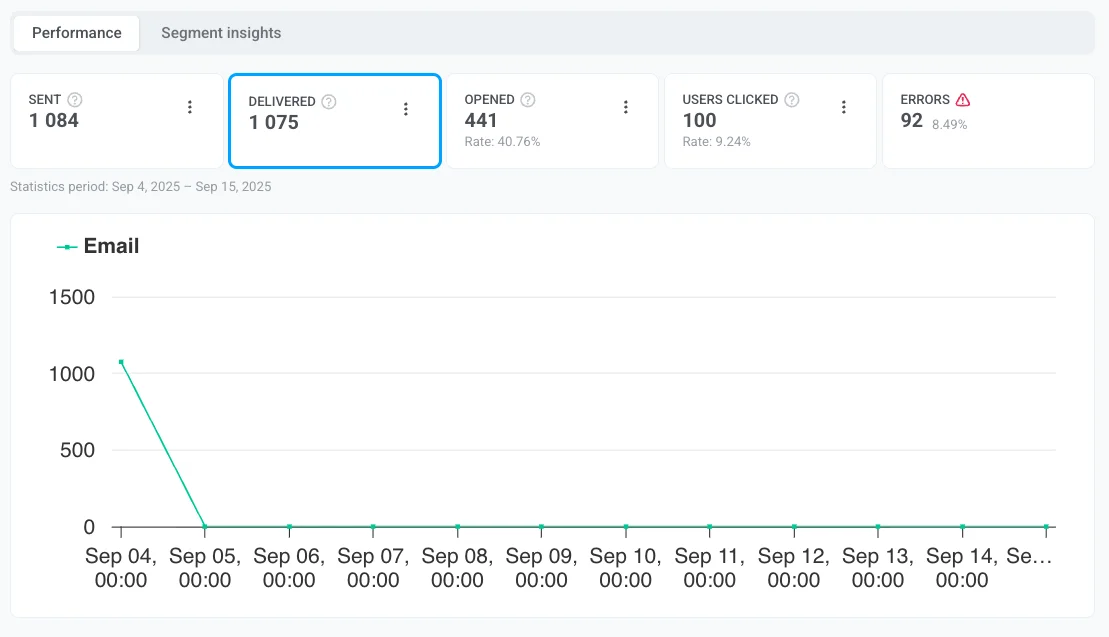
Delivered
Anchor link toThe Delivered metric provides insights into the number of messages successfully delivered to recipients’ inboxes.
Delivery is tracked two ways, similar to opens:
- Delivered: total number of successful deliveries, including any repeat deliveries to the same recipient.
- Delivered unique: number of unique recipients who had at least one message successfully delivered.
Opened unique
Anchor link toThe Opened unique metric shows how many distinct users opened your email. Each user is counted once, regardless of how many times they opened the message.
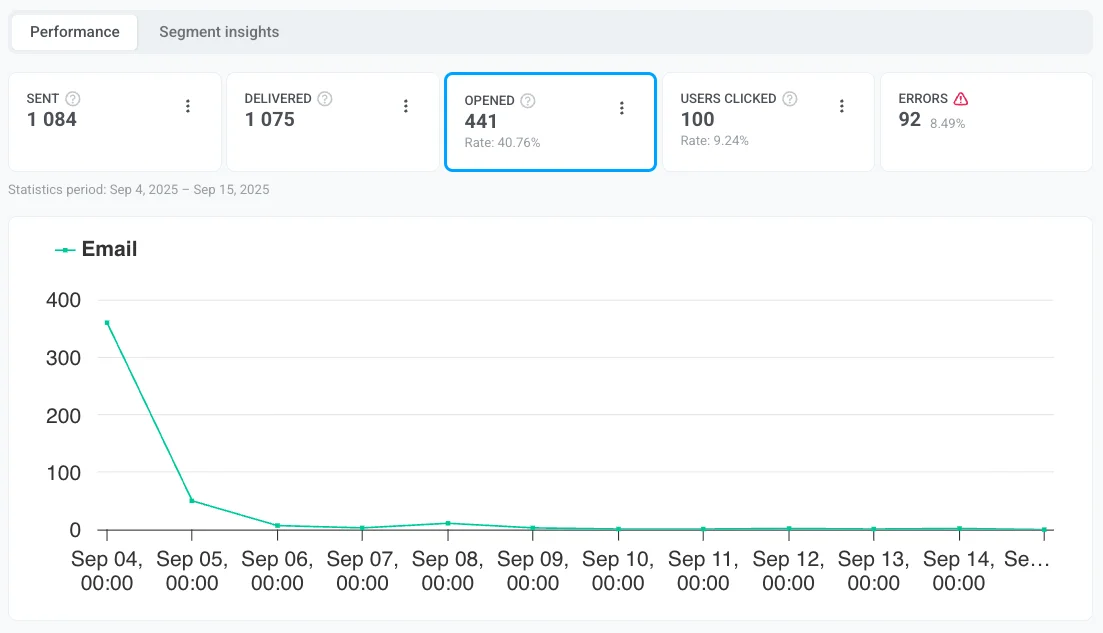
Opened total
Anchor link toThe Opened total metric shows the total number of opens, including repeat opens by the same user. If one user opens the email three times, it counts as three opens. This metric helps you compare results with platforms that report total opens and to gauge how often recipients revisit the message.
Users clicked
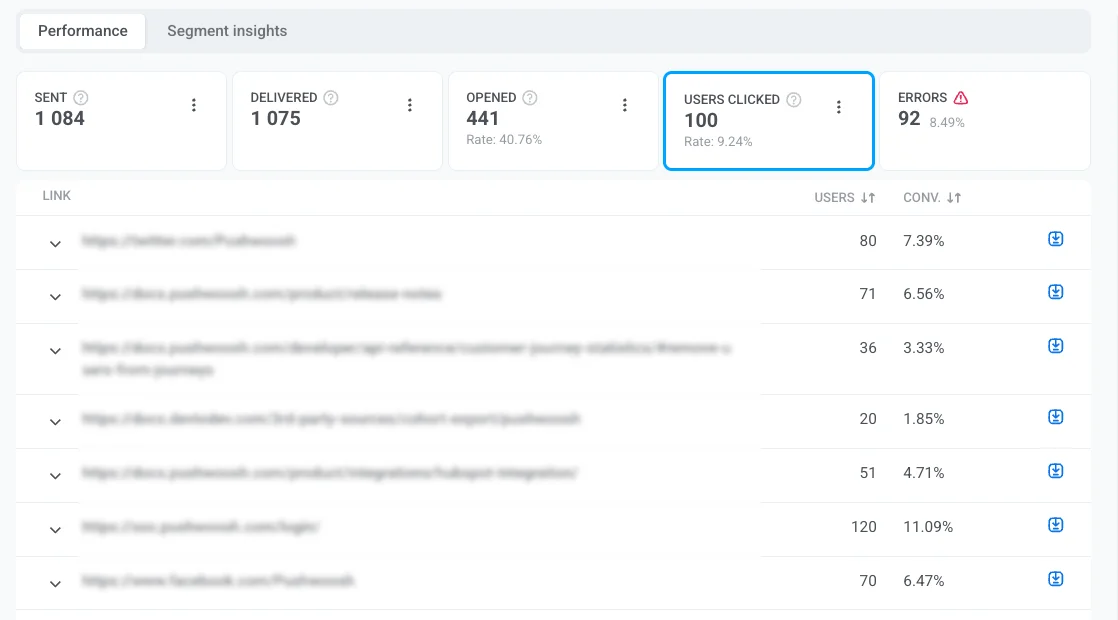
Anchor link toThe Users clicked metric provides valuable insights into how recipients interact with the links in your messages. By analyzing click data, you can evaluate user engagement, identify the most effective call-to-action (CTA) elements, and optimize your messaging content for better performance.
Here you can find the information about:
- Users clicked: The total number of unique users who clicked on the links included in your messages. This helps measure user interaction and determine which links attract the most attention.
- Conversion rate (Rate): The percentage of recipients who clicked on a link and completed a predefined action, such as making a purchase or submitting a form. This metric helps assess the effectiveness of your links and the overall success of your campaign in driving user actions.
The Users clicked also includes a detailed table that breaks down the performance of individual links:
- The number of unique users who clicked on each specific link.
- Conversion Rate: Each link in the table includes its corresponding conversion rate, enabling you to evaluate how effective the link was in driving user actions.
This data helps assess the impact of specific links in driving user actions.
You can also export detailed information about link clicks. For this:
- Next to each link, click the download icon to export click data for that specific link.
- A CSV file will be generated. Once the export is complete, an Exporting complete notification will appear.
- Click the Download CSV button in the notification bar to download the file.
Errors
Anchor link toThe Errors metric provides a detailed breakdown of email delivery performance, identifying errors and issues that occurred during the delivery process. This information allows you to analyze failures, optimize your email strategy, and improve overall campaign performance.
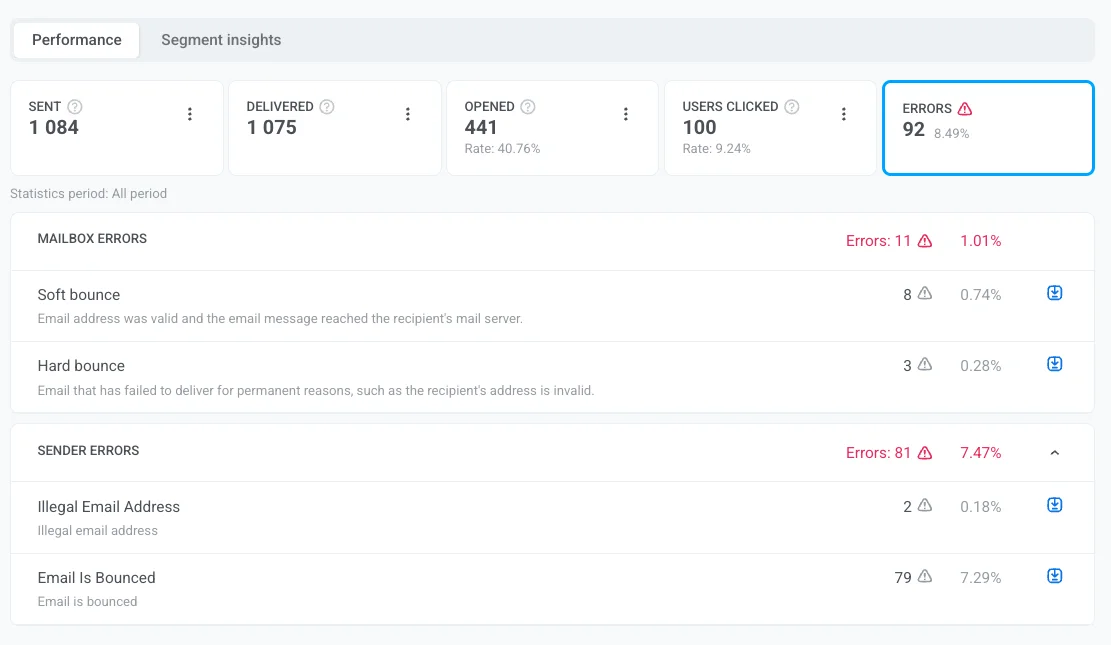
Mailbox errors refer to issues on the recipient’s side that prevent email delivery.
| Error | Description | Suggested action |
|---|---|---|
| Complaint General | Recipient filed a complaint about the email. | Check content and targeting; stop sending to repeat complainers. |
| Complaint Abuse | Recipient reported the email as abusive. | Immediately remove the address to protect reputation and comply with regulations. |
| Bounce Undetermined | Email accepted by server but final delivery status unknown (grey area). | Monitor next sends to the domain; suppress if it recurs. |
| Hard Bounce General | Delivery failed without a specific reason. | Remove the address from the list to protect sender reputation. |
| Hard Bounce Mailbox Full | Recipient’s inbox is full. | Remove the address from the list. |
| Hard Bounce Inactive Mailbox | Email address is no longer active. | Remove the address from the list. |
| Hard Bounce Suppressed | Address is on suppression list (unsubscribed, bounced, or complained). Sending is blocked automatically. | Leave suppressed; do not attempt sending. |
| Hard Bounce Undetermined | Unable to determine the failure reason. | Monitor for patterns and investigate. |
| Soft Bounce General | Temporary delivery failure without a specific reason. | Allow automatic retries; remove if it keeps failing. |
| Soft Bounce Attachment Rejected | Recipient’s server blocked the email due to attachment restrictions (temporary). | Remove/replace the attachment and retry. |
| Soft Bounce Spam | Recipient’s server marked the email as spam. | Remove the address and review content and sender authentication. |
| Soft Bounce Message Too Large | Email exceeded recipient’s size limit. | Reduce image sizes or simplify the template. |
| Soft Bounce Content Rejected | Recipient’s server rejected the message content. | Review email for spam triggers and policy violations. |
| Soft Bounce Mailbox Full | Recipient’s inbox is full (temporary). | Let retries run; remove if it stays full. |
| Soft Bounce Undetermined | Unable to determine the failure reason (temporary). | Monitor for patterns; suppress if it repeats. |
| Soft Bounce Timeout | Server took too long to respond (temporary). | Retry later; reduce send size/rate if needed. |
Sender errors are issues that arise on the sender’s side during the email delivery process.
| Error | Description |
|---|---|
| Illegal email address | The address is invalid or incorrectly formatted, so the system does not attempt to send to it. |
| Email is bounced | The email address had already bounced in a previous campaign, so Pushwoosh automatically skipped it. |
| Email is unsubscribed | The recipient previously unsubscribed from your emails, so no further messages are sent to this address. |
To learn how to prevent these issues and improve deliverability, see Email deliverability best practices.
Frequency capping
Anchor link toBelow the key metrics, the Frequency capping row shows how frequency capping affected this email:
- Suppressions: the number of messages that were not sent because the recipient had already reached their frequency capping limit.
- Affected users: the number of unique users who had at least one message suppressed by frequency capping.
Exporting and segmentation options in the Performance tab
Anchor link toExport recipients list
Anchor link toYou can export a list of recipients for each metric (e.g., Delivered, Opened unique, Opened total, or Clicked) to analyze user behavior or create follow-up campaigns.
For this:
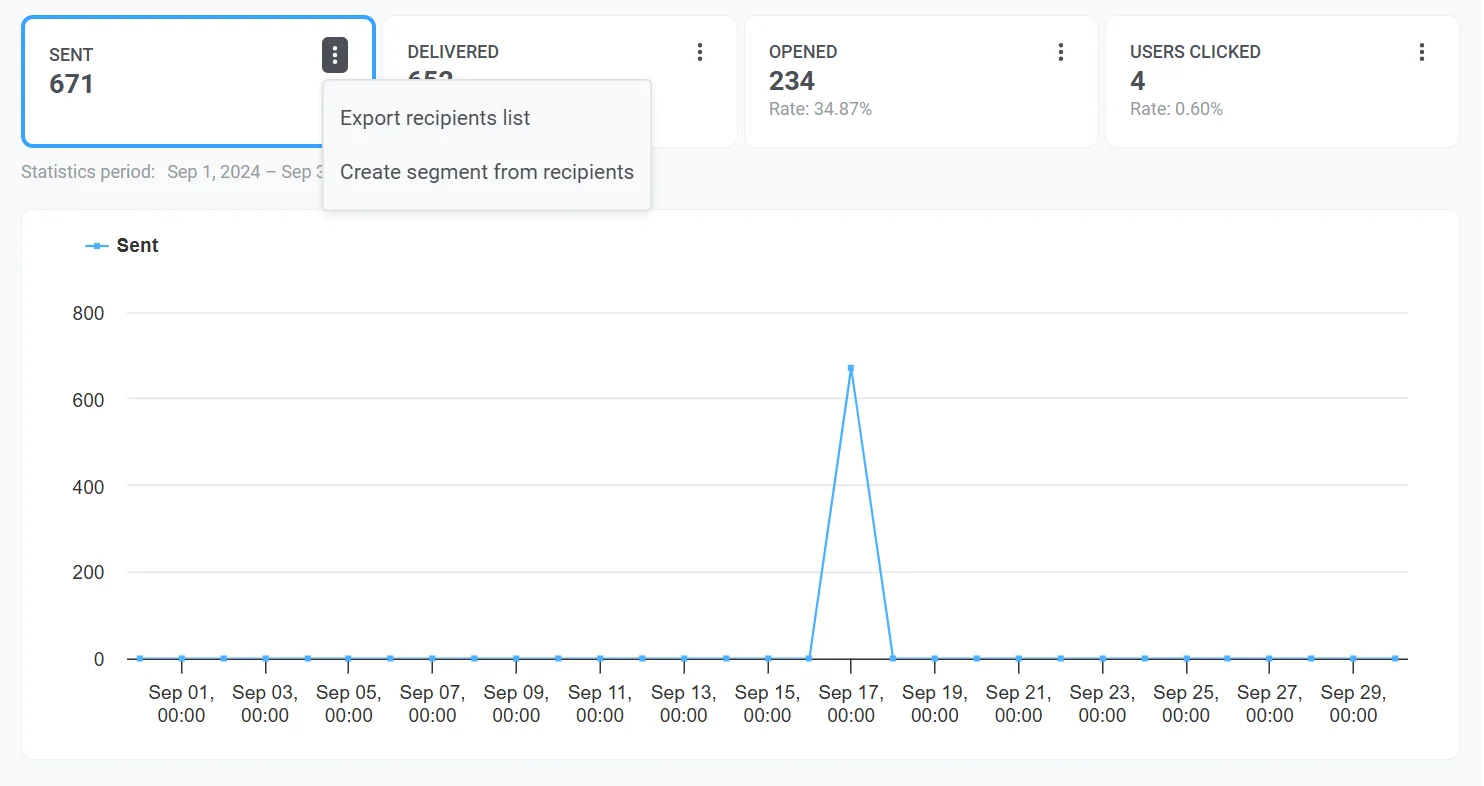
- Click the three-dot menu next to the desired metric (e.g., Sent, Delivered).
- Select Export recipients list to download a list of users for further analysis.
Create segment from recipients
Anchor link toYou can create segments directly from recipients of specific metrics, such as Sent, Delivered, Opened unique, or Clicks. These segments help you personalize and target follow-up campaigns more effectively.
To create a segment:
- Click the three-dot menu (⋮) next to the desired metric, such as Sent, Delivered, or Clicks.
- Select Create segment from recipients from the dropdown menu.
- Give your segment a clear and descriptive name.
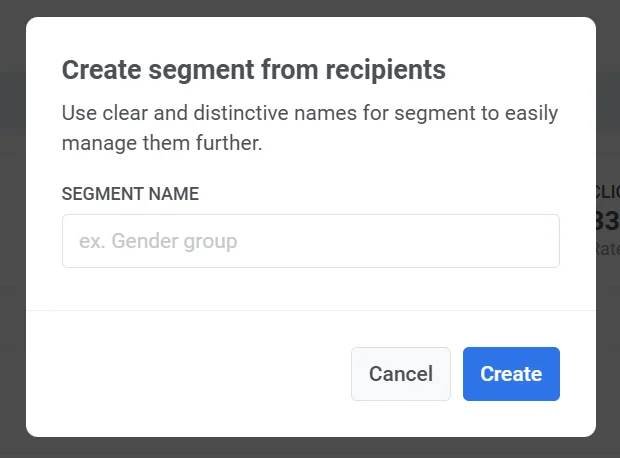
The new segment will be available for use in future campaigns, enabling more precise targeting based on user behavior.
Segment insights
Anchor link toThe Segment insights tab provides detailed performance metrics for each audience segment targeted in your email campaigns. By adding segments, you can track message performance, compare engagement metrics, and optimize your communication strategy.
How to add a segment
Anchor link toIf no segments have been added yet, you will see the Discover segment insights screen. To start analyzing segment performance:
- Click Add first segment.
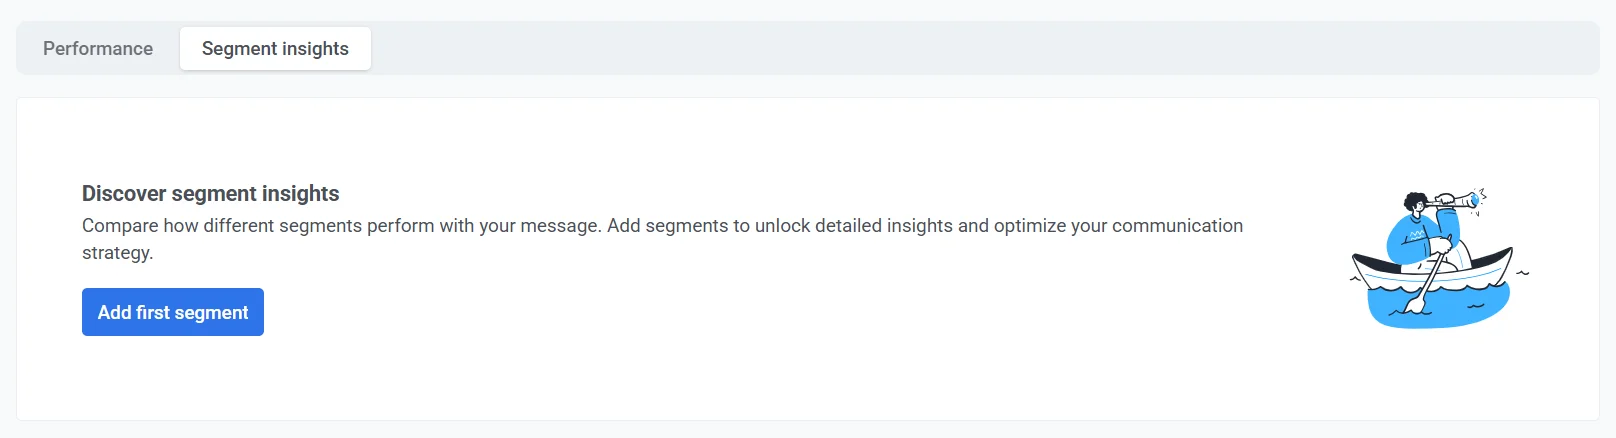
- Use the dropdown menu to select a segment.
- Click Add one more to include additional segments for comparison.
- Click Apply to confirm your selection.
Key metrics
Anchor link toEach segment is displayed with the following performance metrics:
| Sent | The total number of emails sent to the segment. This helps measure the overall reach of your campaign. |
| Opened unique | The number of unique users who opened the email in the segment, indicating user engagement with the message. |
| CTR | The percentage of recipients who clicked at least one link in the email. A higher CTR indicates strong engagement, while a low CTR may suggest adjustments in content or timing. |
Working with segment data
Anchor link to- Refresh all segments: Click this button to update the latest performance data for all listed segments.
- Add segment to compare: Compare performance across multiple segments to identify trends and optimize targeting.
- Individual refresh button: Update data for a specific segment without refreshing all segments.
- Remove segment (✖️ icon): Delete a segment from the list if it’s no longer needed.
Content
Anchor link toThe Content section on the right-hand panel provides a comprehensive overview of the message’s content and campaign details. This section is designed to help you quickly identify the key elements of your message and manage related settings efficiently.
Here you can find:
Message preview
Anchor link toView a visual representation of your message content, such as email or push notification design, to verify how it appears to recipients.
Open preset link
Anchor link toUse the Open Preset link to access and edit the preset used for the message.
Campaign information
Anchor link to- Email subject line
- From Name: The sender’s display name as seen by recipients.
- From Email: The email address from which the message was sent.
Delivery details
Anchor link to- Status: Indicates whether the message has been sent successfully (DONE), scheduled, or still in progress.
- Sent date: The exact date and time the message was delivered to recipients.
- Scheduling options: Displays the chosen scheduling option, such as “Optimal Time.”
- Target segment: Identifies the segment of users who received the message. Click the segment link to view or manage specific segment settings.
Other properties
Anchor link to- Message ID: A unique identifier for the message, useful for tracking and troubleshooting.
- Message Code: An internal code associated with the specific message sent.
If you’re accessing email statistics from the Message History, you can view all message properties by clicking Show all properties.
Gain insights into email performance trends
Anchor link toProject overview
Anchor link toTo assess the overall performance of your email campaigns, navigate to Statistics > Project Overview. Here, you can view the total number of emails sent, delivered, and opened within a selected period, allowing you to compare email performance with other channels.
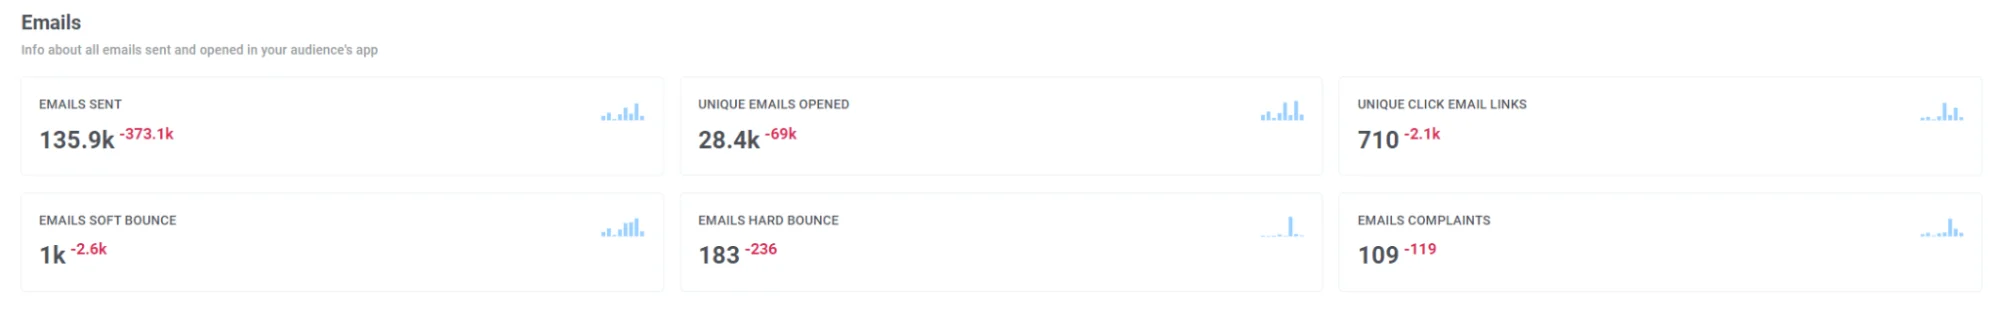
Furthermore, on this page, you’ll find a breakdown of key email metrics such as:
- Emails sent
- Unique emails opened
- Unique clicks on email links
- Emails soft bounce
- Emails hard bounce
- Email complaints
Dashboards
Anchor link toTo analyze the performance of your email campaigns in detail, use pre-built Emails and Application dashboards in the Statistics > Dashboards tab or create your custom dashboard for deeper analysis.
Email dashboard
Anchor link toThe Email dashboard provides you with an in-depth analysis of your email campaign performance. It displays various metrics such as the number of subscribers, email sends, opens, deliveries, and more.
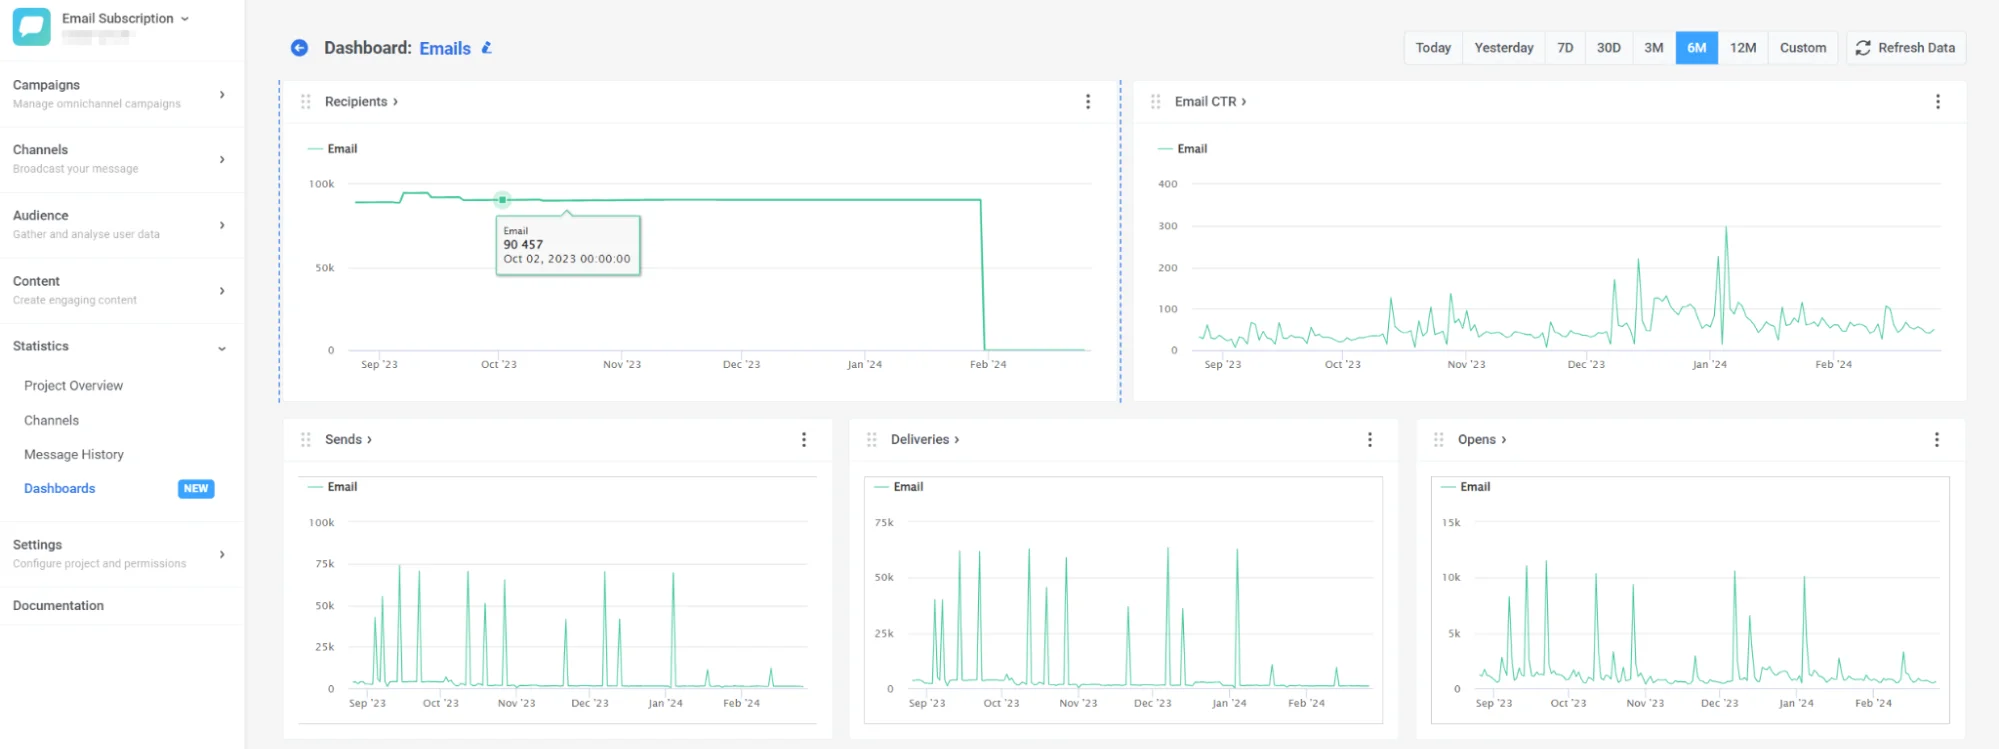
Also, you can customize the dashboard to fit your needs by adding or removing specific metrics, or create a custom dashboard entirely tailored to your campaigns. Learn how to do this here
Application dashboard
Anchor link toThe dashboard enables you to compare your email performance with other channels, providing insights into metrics such as recipients, subscribers, daily and monthly active users, etc., broken down by channel. Learn more
Email analytics FAQ
Anchor link toWhat email analytics does Pushwoosh provide?
Anchor link toPushwoosh provides comprehensive email analytics across multiple levels, including individual message performance, full campaign trends, and channel-wide email statistics. With built-in email dashboards and reporting tools, you can monitor how users engage with your emails and optimize based on actionable data.
Can I export my email analytics data?
Anchor link toYes. Pushwoosh allows you to export detailed email analytics, including:
- Recipient lists filtered by delivery or engagement status
- Link click data for every message
- CSV reports for further analysis in external tools
You can also export segments based on user behavior for targeted follow-ups.
How can I segment and analyze email performance by audience?
Anchor link toYou can create and analyze audience segments directly from the email dashboard or performance tabs. Segments can be based on message status (opened, clicked, bounced) and exported for advanced targeting and performance comparison across user groups.
How do email analytics improve campaign performance?
Anchor link toEmail analytics help you understand how your messages perform in real-world use: from delivery success to user engagement. By using insights from the email metrics dashboards, you can:
- Identify high-performing content
- Test subject lines and calls-to-action
- Optimize send timing and frequency
- Reduce bounce and complaint rates
This data-driven approach boosts open rates, click-throughs, and conversions.